
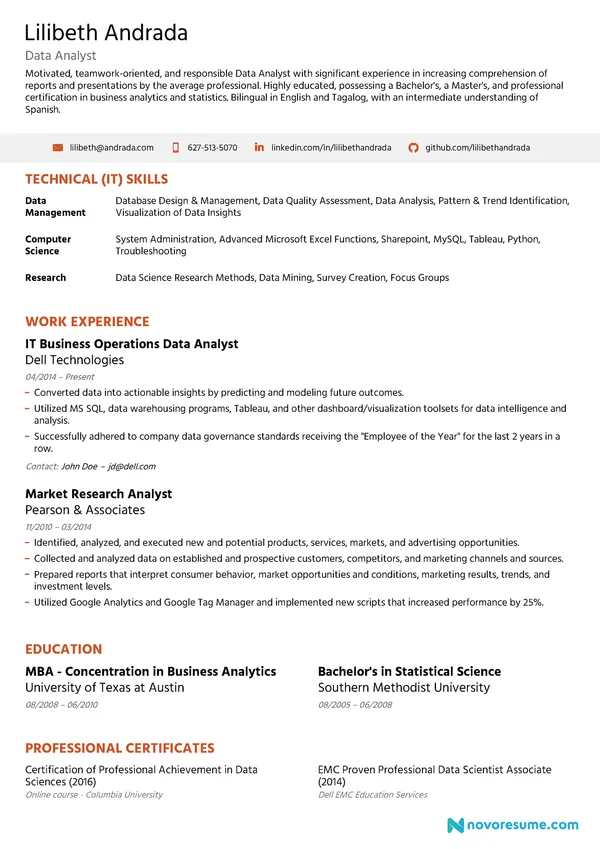
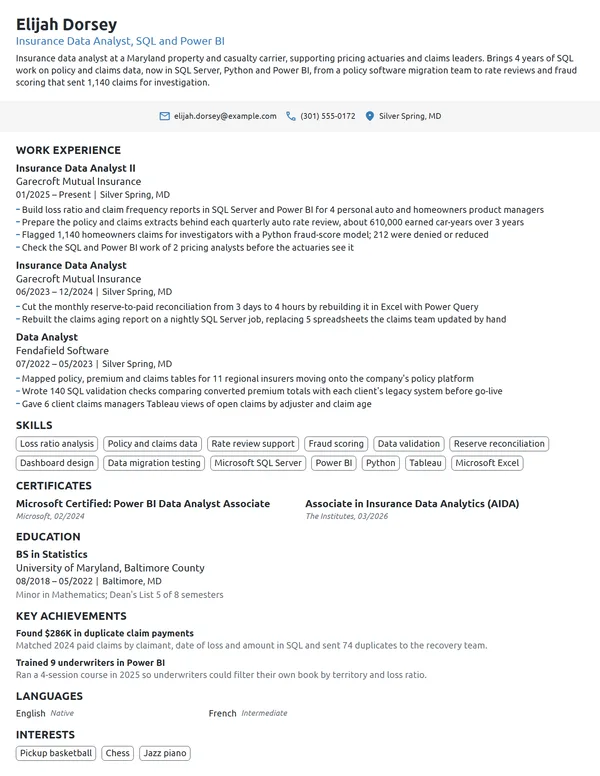
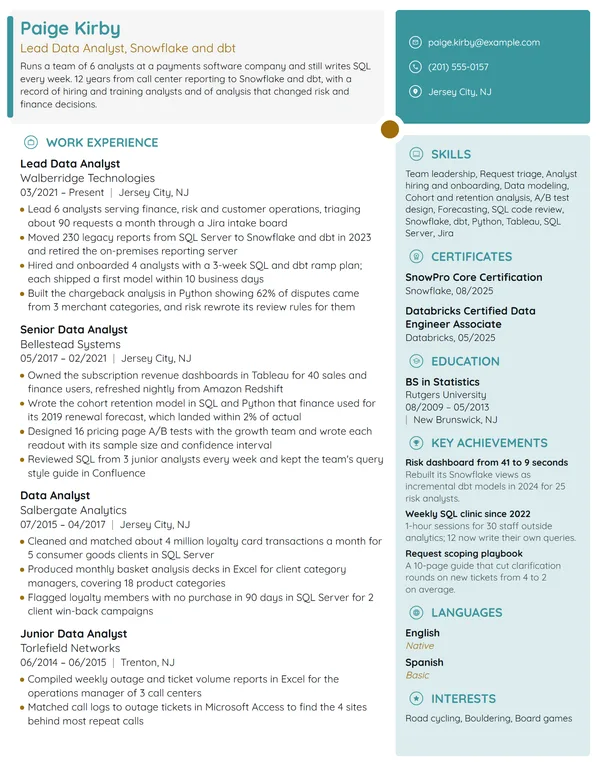
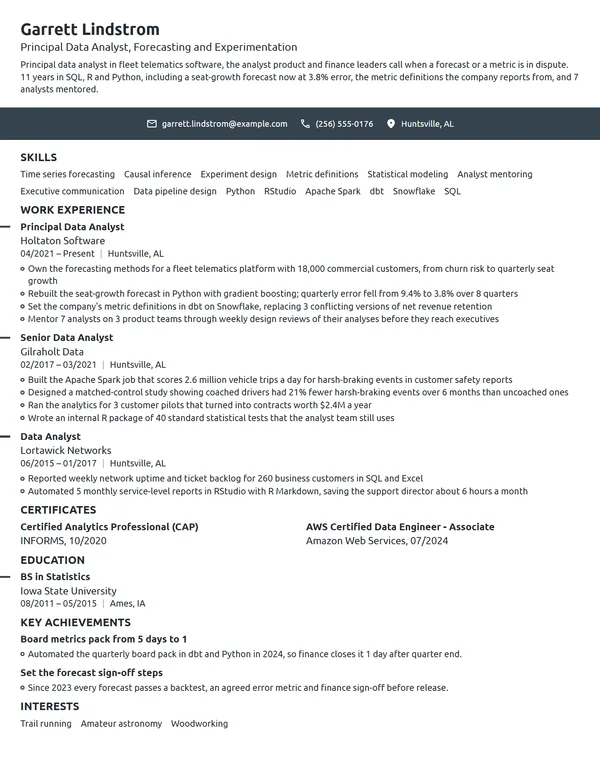
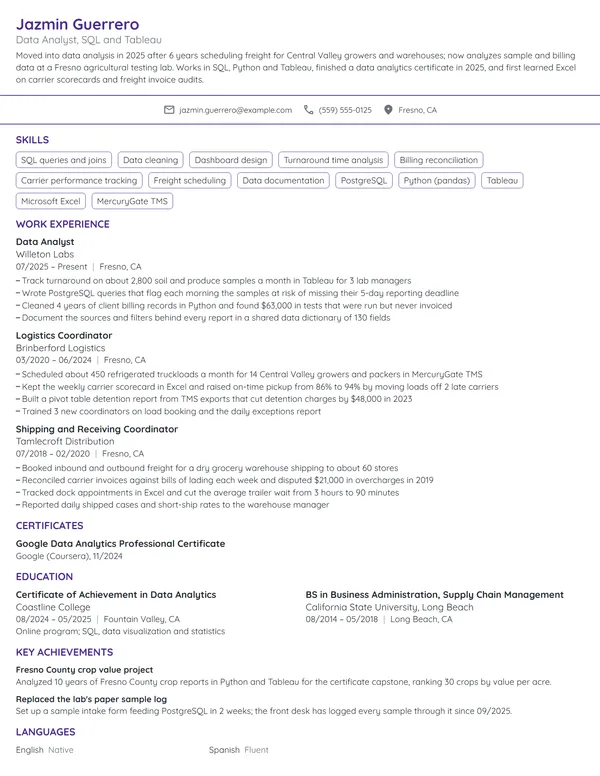
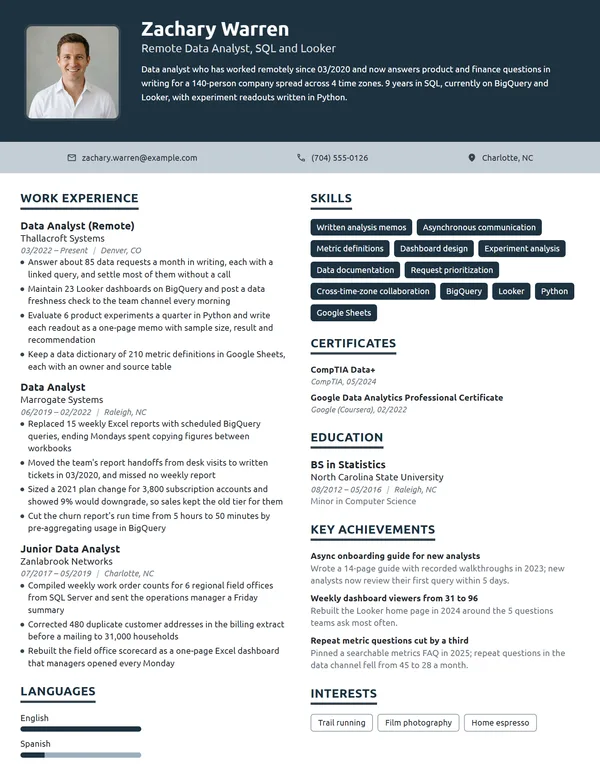
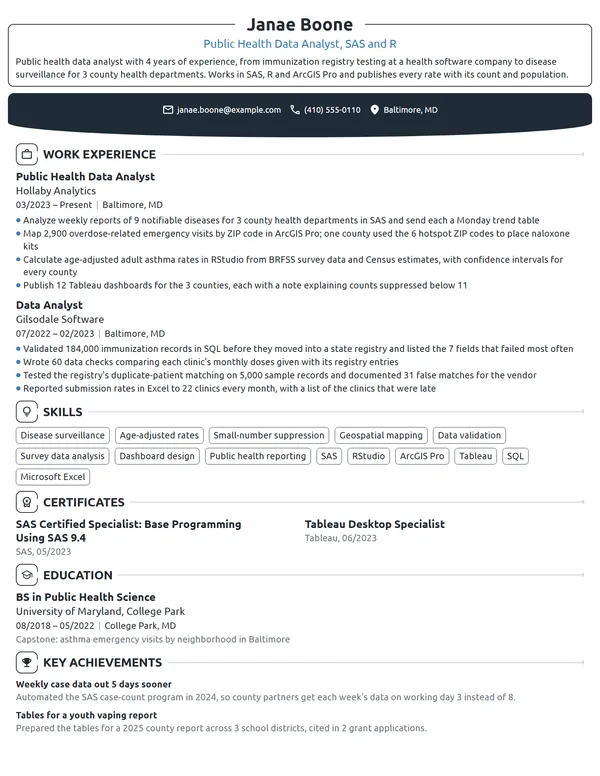
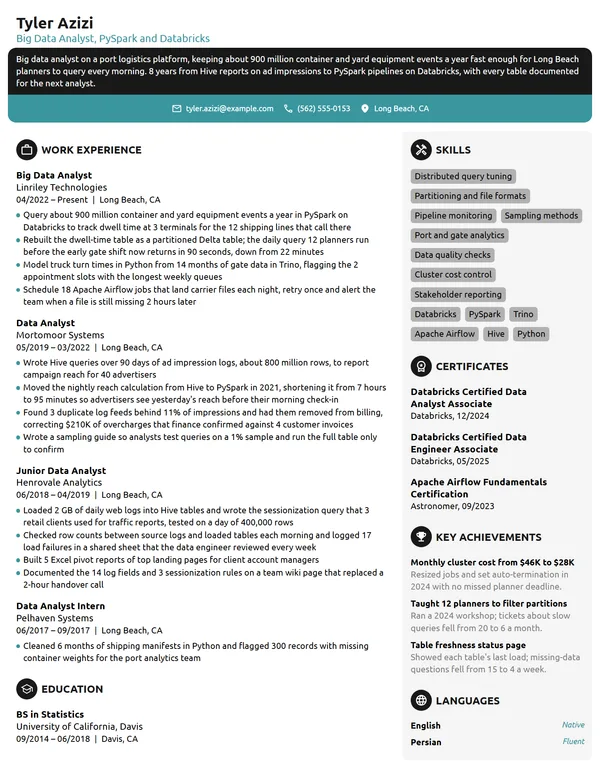
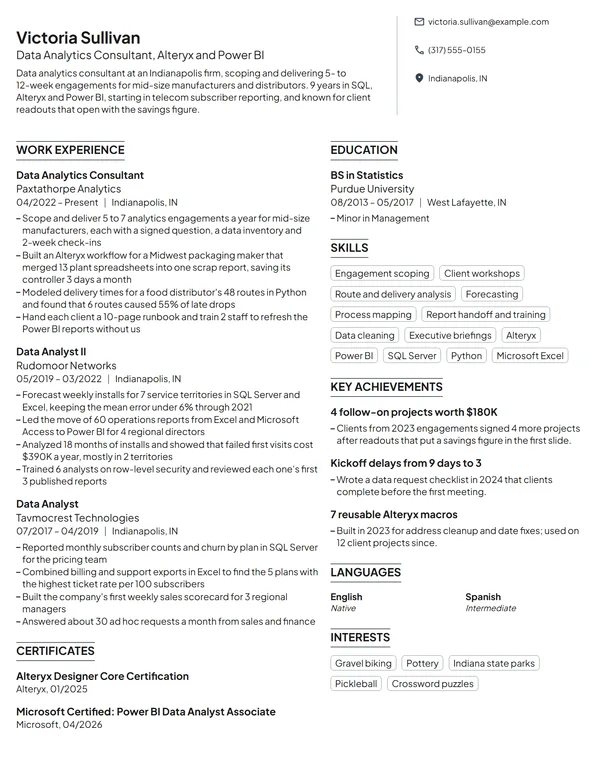
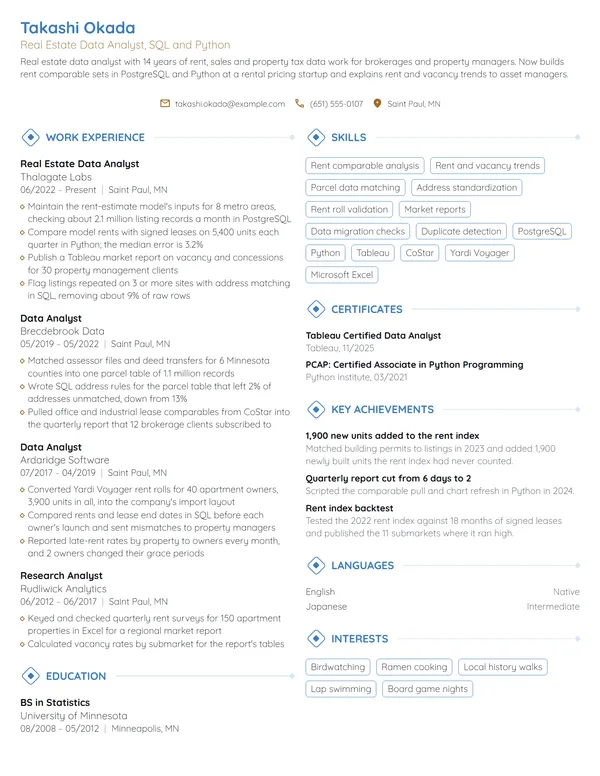
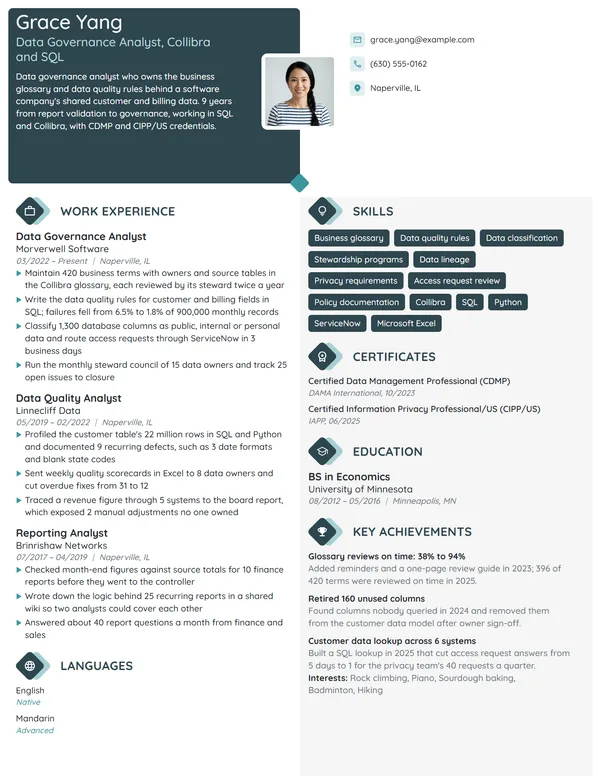
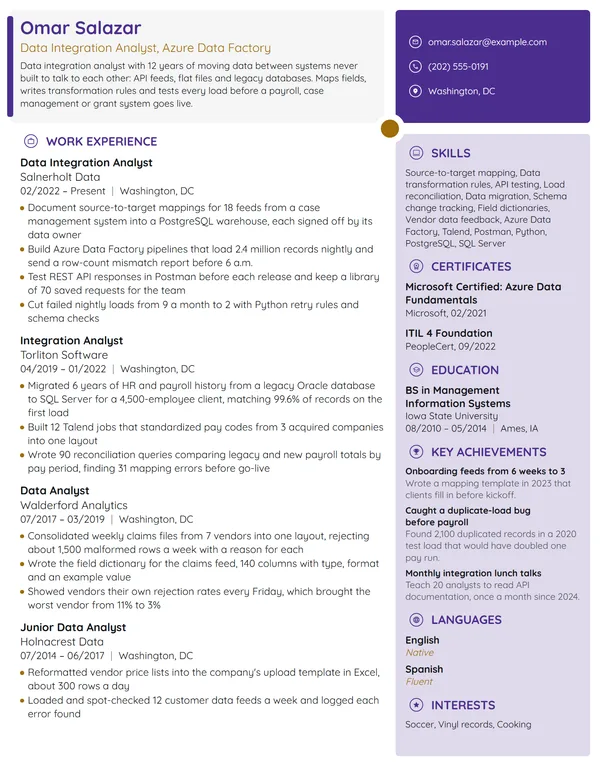
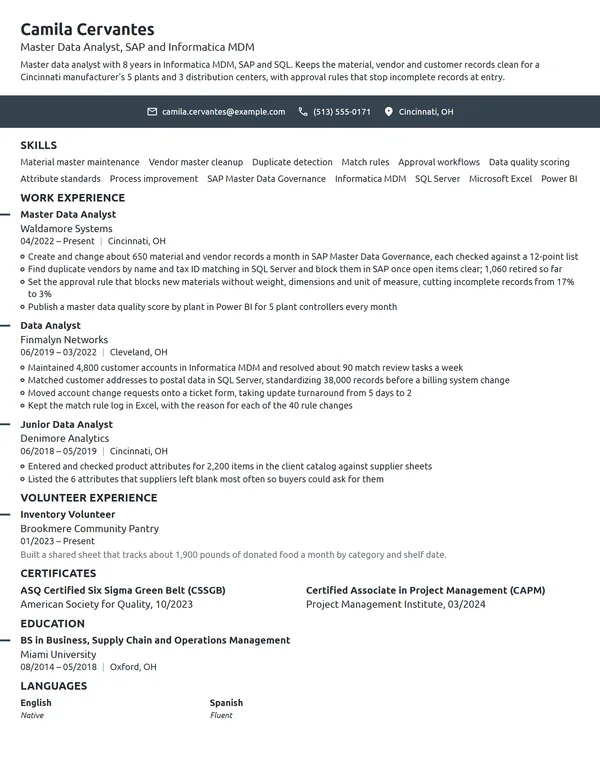
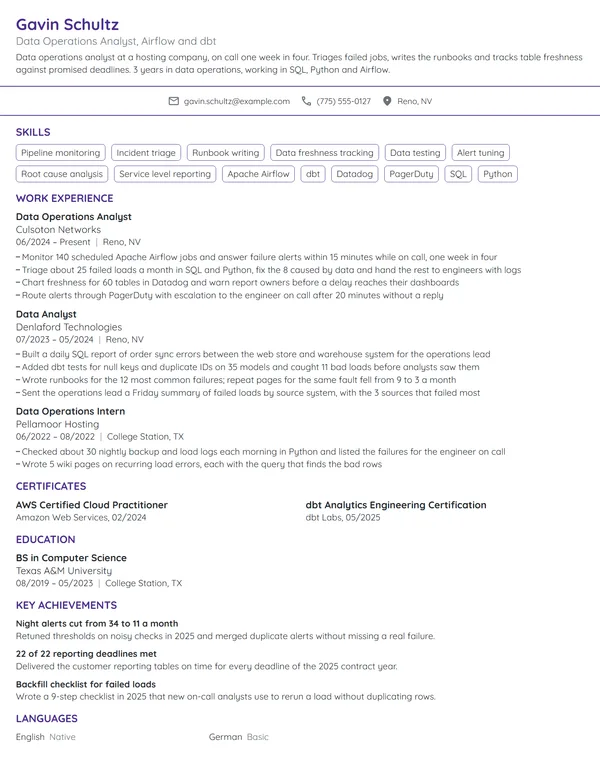
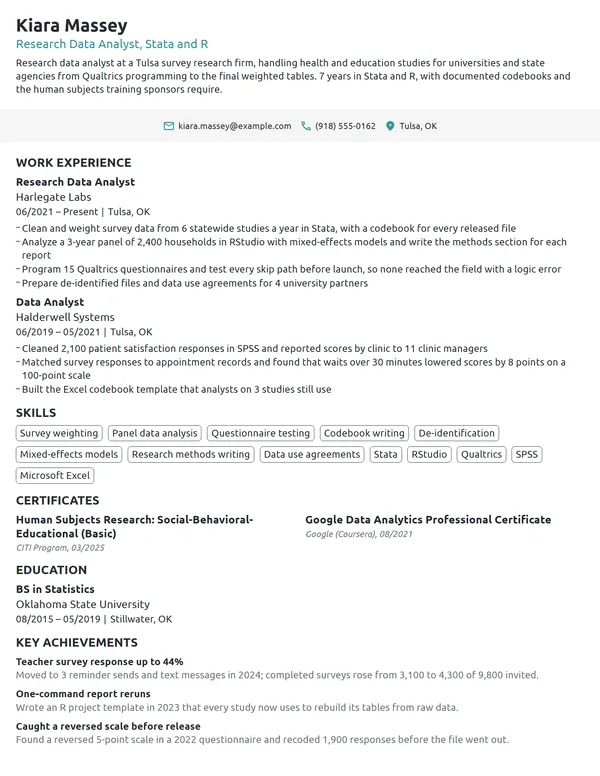
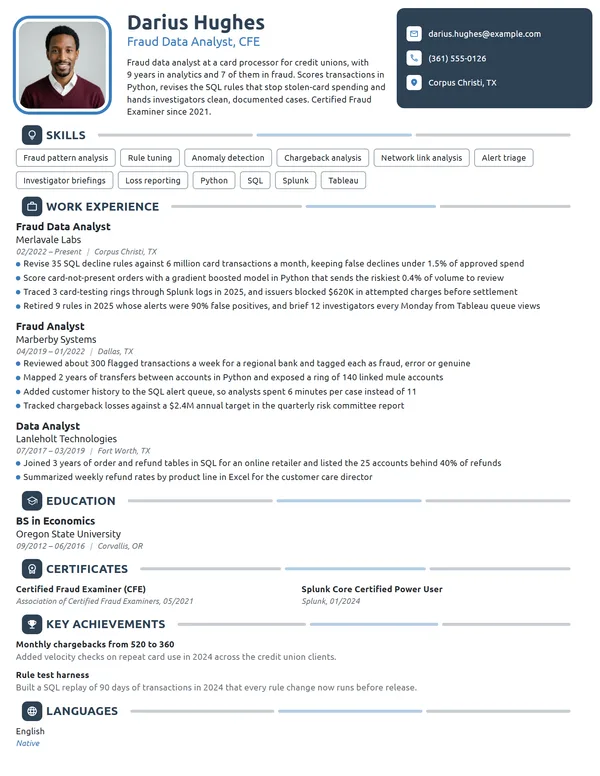
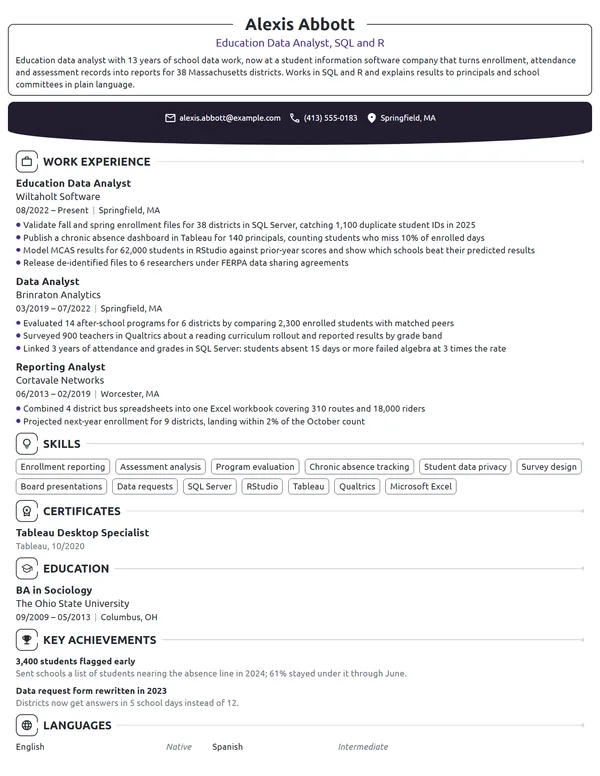
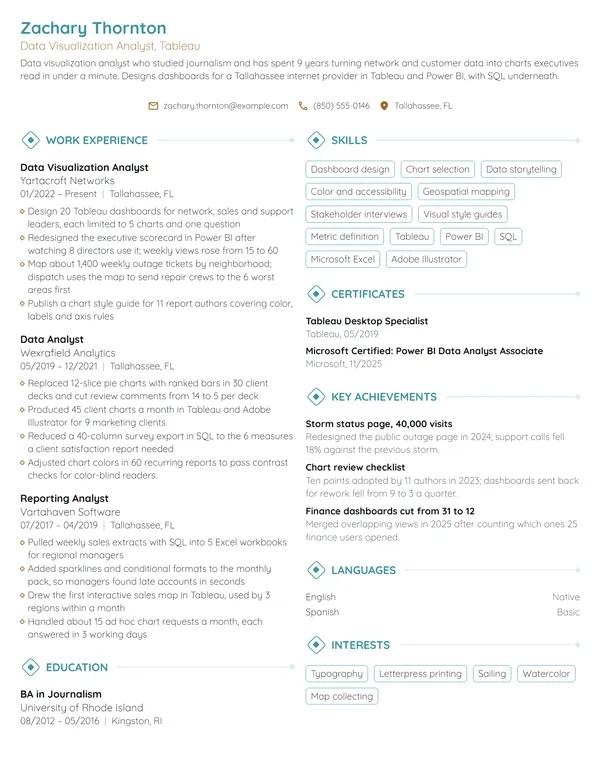
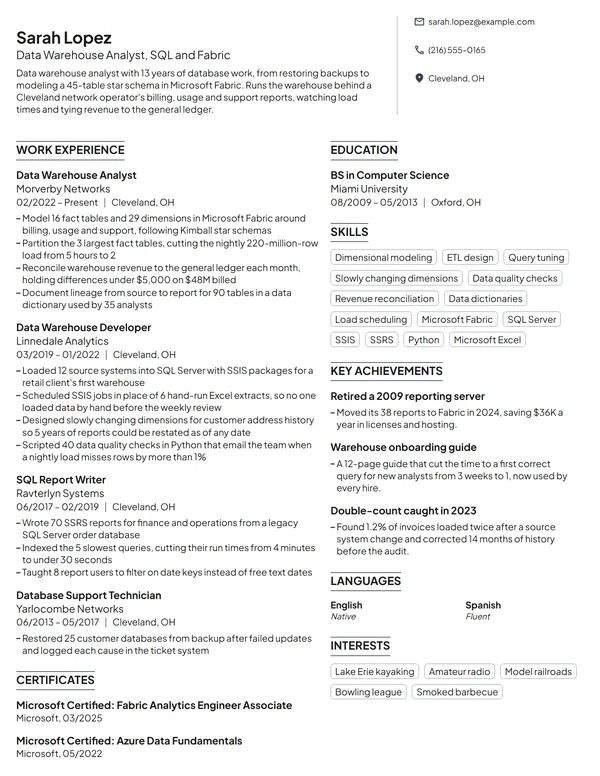
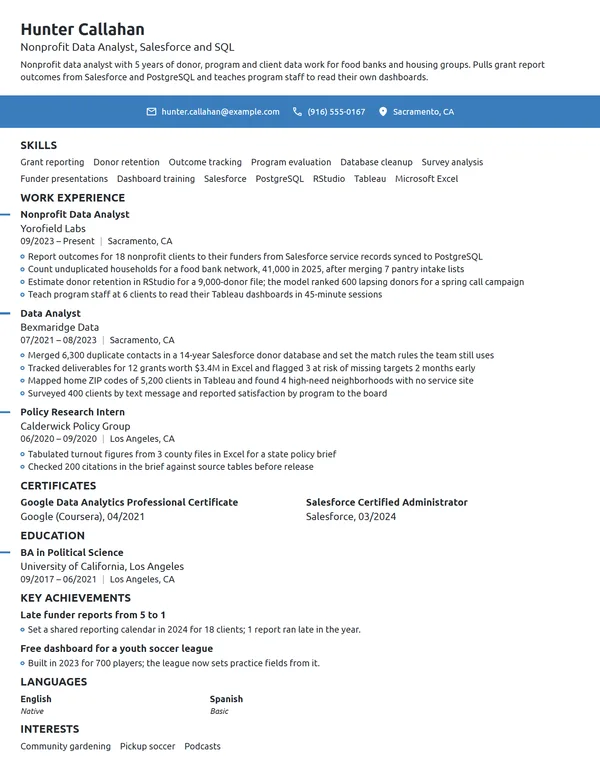
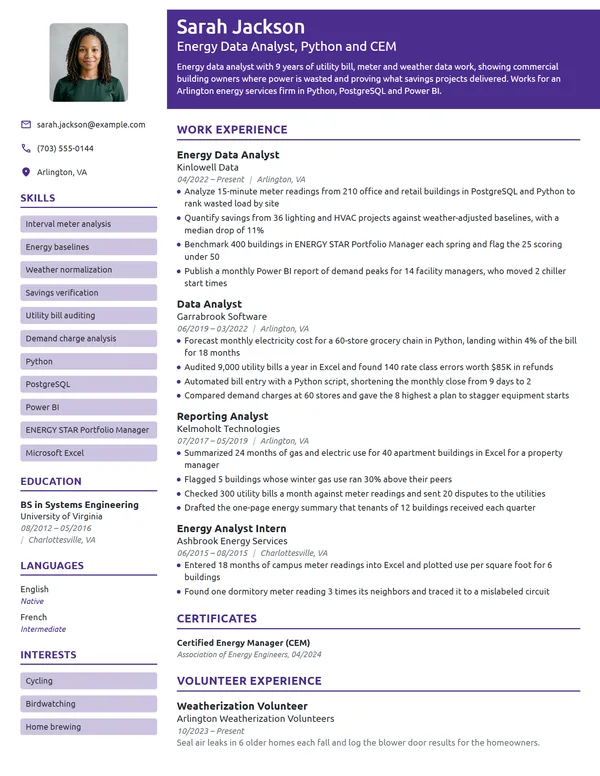
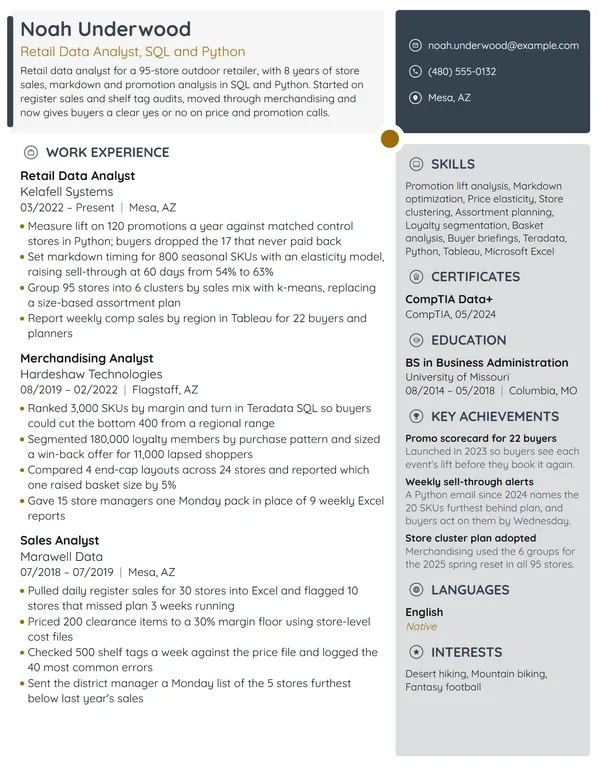
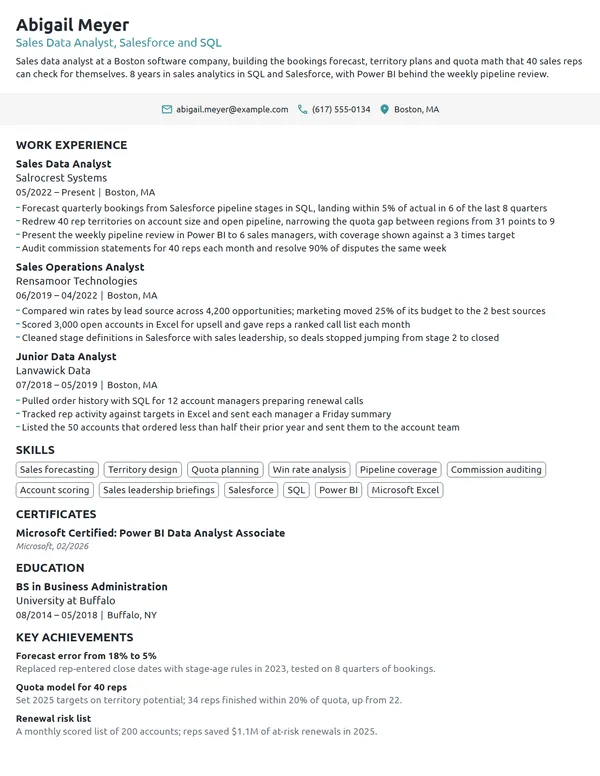
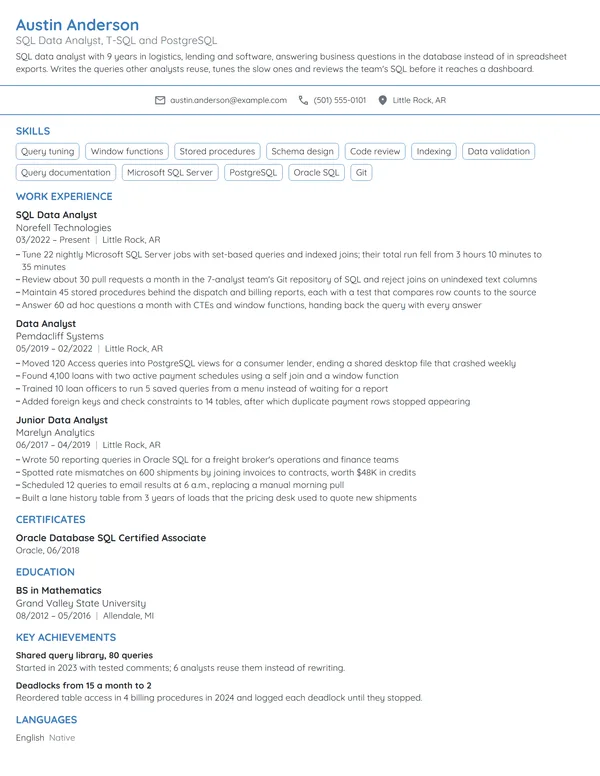
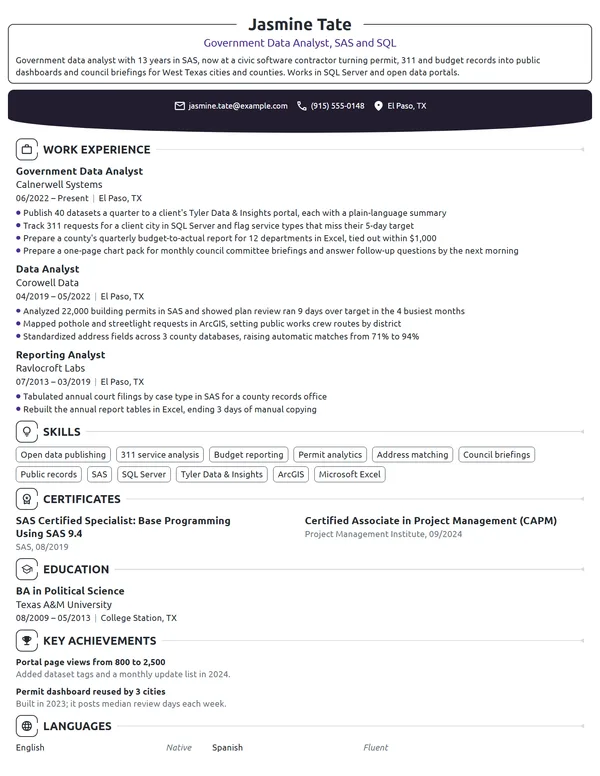
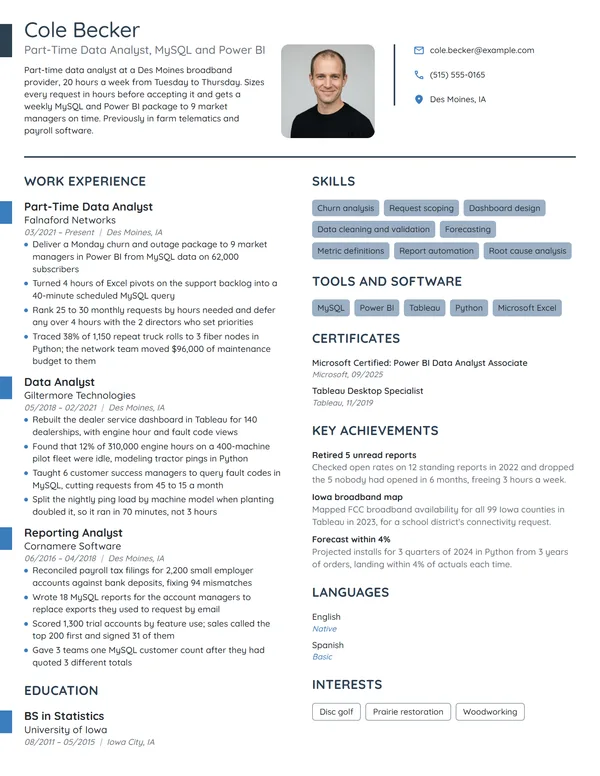
Good analysis changes what a business does next, and hiring managers read your resume looking for proof that yours has. They check the tools you work in, such as SQL, Excel, Python and Tableau or Power BI, how much data you handled, and the results your work led to. Listing the reports and dashboards you built is easy. Showing what changed because of them takes more thought, and each section below shows how to make that come through.
How to Write a Data Analyst Resume - Key Takeaways
- Use the reverse-chronological format on 1 page; a second page fits once you have 10+ years or have led a team.
- Write every bullet as action, tool and number: the rows, dashboards, users, hours or dollars your work touched.
- List SQL, your BI tool and your programming language by exact name in Skills, and prove each one in a bullet.
- Name the decision your analysis changed, not only the report you built.
- Put exam-based credentials such as the Microsoft Power BI Data Analyst Associate in Certificates with their month and year.
- Run the file through an ATS resume checker before you apply, since analytics postings are screened for tool names.
What hiring managers look for in a data analyst resume
A hiring manager in analytics reads your resume for 3 answers: can you get the data out yourself, can you turn it into something people use, and did anyone decide differently because of it. O*NET's closest occupation, business intelligence analysts, lists core tasks such as generating reports that summarize business data for executives and managers, keeping dashboards and databases up to date, and documenting what each report must show. For data scientists, the BLS lists collecting and analyzing data, presenting findings with visualization software and making business recommendations to stakeholders.
Those tasks set your sections. Keep the headings standard so an applicant tracking system files each part correctly:
- Name, a headline such as Data Analyst, SQL and Power BI, and your contact details
- A 2 to 3 line summary or objective at the top; it needs no heading
- Work Experience, current role first, with the tools you used inside each bullet
- Skills: your query language, programming language, BI tool and warehouse
- Certificates, exam-based credentials first
- Education, with a capstone or thesis if it used real data
- Optional: Key Achievements for portfolio projects, Volunteer Experience or Languages
Best format for a data analyst resume
Use the reverse-chronological resume format: your latest role at the top, each with the job title, the employer, its city and MM/YYYY dates. Analytics careers are judged on how recent your tool stack is, and this order puts your current SQL, BI and cloud work in the first lines a manager reads. If you moved from reporting analyst to data analyst inside one company, show both titles with their own dates so the step is visible.
- Best for most data analystsReverse-chronologicalYour jobs, newest first, with your results under each one.Best for: A steady work history in your field
- FunctionalSkills grouped up top, with a short work history below.Best for: Gaps or very little experience
- CombinationA skills section first, then your full work history.Best for: A career change with strong skills
One page covers most analysts with under 10 years of experience. Move to 2 pages when you lead a team, own an analytics function or have several distinct domains to show, and keep your current role and your tools on page 1. For senior titles, the senior data analyst resume examples show what earns a place on page 1.
| Setting | What to use |
|---|---|
| Length | 1 page under 10 years; up to 2 pages for leads, managers and principal analysts |
| Dates | MM/YYYY for every role, and Present for the one you hold now |
| Headline | Title plus your 2 core tools: Data Analyst, SQL and Tableau |
| Tools line | Tools named as the vendor writes them: Power BI, Snowflake, BigQuery, pandas |
| Typeface | One clean font, body text between 10 and 12 pt, no tables or text boxes |
| Photo and personal details | Usually no photo in the US and Canada; leave out your birth date, marital status and Social Security number |
| File | A text-based PDF, or Word when the application portal asks for it |
Most US and Canadian resumes carry no photo. Analytics postings at larger firms run through parsing software, so a single-column file with real text, not a chart or an image of your dashboard, reads cleanly into their system.
Data analyst resume summary vs. objective
Pick by one test: have you held a job with analyst or a data title in its name? If yes, write a resume summary with your years, your domain, your core tools and your best measured result. If not, because you are graduating or switching fields, write a resume objective that names the analyst role you want, the training you finished and the strongest number from your earlier work.
Data analyst resume summary formula
Title with X years in industry or domain, working in query language, programming language and BI tool. 1 analysis result with a number and the decision it changed. Certification or the credential you are working toward.
Example
Data analyst with 7 years in retail and food distribution, working in SQL, Python and Power BI. Built the demand forecast that cut out-of-stocks at 6 warehouses from 7% to 4%. Microsoft Certified: Power BI Data Analyst Associate.
Don't
Detail-oriented data analyst with strong analytical skills and a passion for turning data into insights.
Do
Data analyst with 5 years in healthcare claims, querying about 2 million claims a month in SQL and SAS. Found the coding pattern behind rising denials and helped bring the denial rate from 11% to 8%.
The rewrite gives the domain, the data volume, the tools and a result someone outside analytics would care about.
How to write data analyst work experience bullets with numbers
Give your current role 3 to 4 bullets and older roles 1 to 4, depending on how much each one shows about the job you want. Each bullet needs a verb, the tool, the size of the data or audience, and the result, in that order. For an analyst, the achievements on your resume are usually time saved, errors removed, money found or a decision someone made from your work. The table lists what to count in each part of the job.
| Area | What to count | Example bullet |
|---|---|---|
| Dashboards and reporting | Dashboards owned, users, refresh frequency | Moved the regional sales dashboard from weekly to daily refresh for 85 users in Tableau. |
| Automation | Manual reports replaced, hours saved, run time | Consolidated 11 recurring Excel reports into 1 dbt and Power BI model. |
| Data quality | Error or duplicate rates, rows cleaned, checks added | Cut duplicate customer records from 8.2% to 0.6% across 1.4 million rows with SQL matching rules. |
| Analysis and decisions | Dollars found or moved, segments, forecasts | Ran a churn analysis on 36,000 subscribers that shifted $1.2M in renewal spend to the 2 segments most at risk. |
| Experiments | Tests run, sample sizes, lift | Analyzed 22 A/B tests a quarter for the product team, including a checkout change with a 3.1% conversion lift. |
| Stakeholder requests | Requests per quarter, turnaround time | Answered 95% of 300 quarterly ad hoc requests within 2 business days. |
Below is one analyst's history written that way. The current role carries the tools and the biggest result, and the earlier role keeps only its strongest lines.
Work Experience
- Build and maintain 14 Power BI dashboards used by 120 sales and supply chain staff across 6 distribution centers.
- Rewrote the weekly fill-rate report in SQL and Python, cutting its run time from 6 hours to 25 minutes.
- Found a pricing error on 2,300 SKUs through a margin variance analysis, recovering $410K in its first year.
- Reported on about 40,000 online orders a week in Excel and SQL, and automated 9 manual reports to save the team 12 hours a week.
Don't
Created dashboards for management.
Do
Built a Tableau dashboard of store labor costs for 9 regional managers, replacing a spreadsheet that took 4 days a month to assemble with 1 that refreshes overnight.
Say who used the dashboard and what it replaced.
Don't
Used SQL to query databases.
Do
Rewrote 18 monthly finance queries in Snowflake SQL with window functions, bringing the longest run from 40 minutes to 3.
Data analyst skills: SQL, Python and BI tools for your resume
Pick 6 to 8 skills that match the posting and that a bullet on your resume already proves. The technical skills for your resume come first for this job: a query language, a programming language, a BI tool and the statistics you actually use. Add machine learning only when you have built and shipped a model.
Hard skills for data analysts
- SQL (joins, CTEs, window functions)
- Python (pandas) or R
- Data cleaning and validation
- Dashboard design
- Data modeling for BI
- Descriptive and inferential statistics
- A/B test analysis
- Forecasting
- ETL and data pipelines
- Advanced Excel (Power Query, pivot tables)
Soft skills analytics managers value
- Turning a vague request into a clear question
- Explaining findings to non-analysts
- Skepticism about the data
- Prioritizing competing requests
- Written documentation
- Working with engineers and business owners
Name your software by its product name. In O*NET's technology data for business intelligence analysts, SQL, Python, R, SAS, Tableau, Microsoft Power BI, Snowflake and Microsoft Excel are all flagged as in demand, and Alteryx, Looker and Apache Spark as hot technologies. Google's free reporting tool has changed names twice: it became Looker Studio in October 2022 and went back to Data Studio in April 2026, so write the name it had while you used it.
Data analyst certifications: Power BI, Google, CAP and AWS
No license is required to work as a data analyst, so certificates do a different job here: they back up a tool claim or show training if your degree is in another field. List certifications on your resume with the exact name the issuer uses, the issuer and the month you earned it. Drop any credential that has expired.
| Credential | Issued by | What it takes |
|---|---|---|
| Microsoft Certified: Power BI Data Analyst Associate | Microsoft | Exam PL-300 on preparing, modeling, visualizing and securing data in Power BI, with Power Query and DAX; renewed every 12 months through a free online assessment. |
| Google Data Analytics Professional Certificate | Google, on Coursera | A self-paced online program of about 240 hours covering SQL and Tableau; no prior experience needed. |
| Certified Analytics Professional (CAP) | INFORMS | 3 levels: CAP-Essentials and CAP-Pro need no application, while CAP-Expert requires an application with education and experience criteria. |
| AWS Certified Data Engineer (Associate) | Amazon Web Services | A 65-question, 130-minute exam; AWS recommends 2 to 3 years in data engineering or architecture. Valid for 3 years. |
Course certificates vs. exam-based certifications
A proctored exam such as PL-300 tells a manager you passed a test on the tool. A course certificate shows you finished a training program. Both belong under Certificates, but list the exam-based ones first. Until March 2022 the Power BI exam was DA-100, so an older certificate may show that code. AWS retired its Data Analytics Specialty exam in April 2024; its closest current exam is the Data Engineer Associate. If an exam is booked but not passed, write scheduled and the month after the name.
Certificates
- Microsoft Certified: Power BI Data Analyst Associate, Microsoft, 09/2023
- Google Data Analytics Professional Certificate, Google (Coursera), 06/2021
- CAP-Pro, INFORMS, scheduled 12/2026
How to list a degree, bootcamp or analytics certificate program
The BLS says data scientists typically need at least a bachelor's degree, commonly in mathematics, statistics, computer science, business or engineering. For business intelligence analysts, 68% of O*NET's survey respondents said the job needs a bachelor's degree and 23% a master's. Any of those degrees works on a data analyst resume, and so does economics or a social science with a statistics sequence.
Follow the standard rules for listing education on a resume: degree, school, city and graduation month. Within 3 years of graduating, add a GPA of 3.5 or higher. A capstone or thesis that used real data earns 1 line under the degree, with the dataset's size. A bootcamp or a college certificate program goes under Education too, with its dates, while a vendor exam goes under Certificates.
Education
Capstone: regression analysis of 3 years of Milwaukee County transit ridership data in R.
Entry-level and career-change data analyst resumes
Without an analyst title yet, your resume has to show the work itself. Lead with an objective, then put your strongest evidence where a manager can count it. The entry-level data analyst resume examples show a layout for graduates and interns.
- Portfolio projects: 1 to 2 under Key Achievements, each with the public dataset, its size, the tool and the finding.
- Reporting inside your current job: the Excel models, trackers or reports you already build, written as Work Experience bullets with numbers.
- Capstone or thesis: 1 line under your degree with the data, the method and the result.
- Nonprofit or volunteer analysis: under Volunteer Experience, with the records you cleaned or the report the group used.
Don't
Motivated professional seeking an entry-level data analyst role to grow my skills.
Do
Retail store manager of 8 years moving into data analysis, with the Google Data Analytics Professional Certificate and 3 portfolio projects in SQL and Tableau. Cut inventory shrink across 12 stores from 2.9% to 1.7% with weekly loss reports built in Excel.
A career-change objective still needs a number from the old job and proof of the new skills.
If you are coming from operations, logistics, finance or sales, keep reverse-chronological order and put your first data role or your certificate at the top. Under the older jobs, keep the bullets where you already worked with numbers: inventory counts, forecasts, reconciliations or KPI reports. The career-change resume examples show the layout, and your cover letter can explain the move in 2 sentences, as the data analyst cover letter examples do.
Data Analyst resume FAQ
Do you need a degree to become a data analyst?
Usually, yes. 68% of O*NET's survey respondents for business intelligence analysts said the job needs a bachelor's degree, and the BLS names mathematics, statistics, computer science, business and engineering as common fields. Without one, a certificate program, a vendor exam and portfolio projects with real datasets give a manager something concrete to judge.
Which certifications are worth adding to a data analyst resume?
The ones that match the posting's tools. Microsoft Certified: Power BI Data Analyst Associate fits Power BI shops, the Google Data Analytics Professional Certificate fits career changers, and INFORMS's CAP suits analysts who want a vendor-neutral credential. List each with its issuer and month.
Can I list Python or SQL if I only used them in a course?
Yes, if you can prove it. Add a portfolio project under Key Achievements that names the dataset, its size and what you found with the tool. A skill with no project or job behind it is easy to spot in a technical interview.
How long should a data analyst resume be?
1 page for most analysts with under 10 years of experience. Leads, managers and principal analysts can use 2 pages, as long as the current role and the tools section sit on the first one.
Where do portfolio projects go on a data analyst resume?
Under Key Achievements, 1 to 2 lines each: the project name, the public dataset and its size, the tool and the finding. Once you hold an analyst job, keep only the project that shows a skill your work history does not.
How do I show results on a data analyst resume if the numbers are confidential?
Use relative figures and scale instead of revenue: percentages, rows, users, hours saved or the number of reports replaced. A reduction from 6 hours to 25 minutes or a 4-point drop in an error rate tells the story without exposing your employer's financials.
Should I write Looker Studio or Data Studio on my resume?
Write the name the tool had when you used it. Google renamed Data Studio to Looker Studio in October 2022 and changed it back to Data Studio in April 2026, so a job that ran from 2023 to 2025 says Looker Studio.
Is a data analyst resume different from a business intelligence analyst resume?
Only in emphasis. The tasks O*NET lists for business intelligence analysts, such as reports, dashboards and trend analysis, cover much of a data analyst's work too. A BI resume leans on dashboards, data models and report users, while a data analyst resume shows more ad hoc analysis, statistics and the decisions it informed. Match the title and the tools to the posting.
How much do data analysts make?
The BLS does not publish a separate data analyst wage. Its nearest group, data scientists, had a median annual wage of $120,230 in May 2025, and the BLS projects 35% employment growth for that group from 2025 to 2035. Leave pay off your resume and raise it at the offer stage.
Next steps
Pick the example closest to your domain and level, keep its structure, and replace the tools, data sizes and results with your own. Build it in our resume builder or start from one of our templates, then send it with a cover letter that names the team you want to join and your best result.