Updated on March 4, 2026
108 Employee Turnover Statistics & Trends for 2026
Discover 108 employee turnover statistics for 2026 with data-backed insights for your job hunt.


Novorésumé got people hired at
If you’re thinking about making a career move this year, you're not the only one.
More than half of U.S. employees are open to or actively seeking new job opportunities.
Whether you're exploring your options, negotiating a raise, or trying to understand what's happening in your industry, understanding employee turnover trends can give you a real advantage.
To help you benchmark your own situation, we’ve compiled a list of employee turnover statistics and trends you can use to make an informed decision about your next step.
The data reveals how often people leave their jobs, which industries have the most movement, and what's driving workers to seek new opportunities.
Let's dive in!
Getting started on your resume? Use our professional resume builder to create it in minutes!
Choose a resume template to get started.
11 General Employee Turnover Statistics
Before diving into the specifics, here's a snapshot of where the U.S. job market stands right now. These numbers paint a picture of a workforce that's increasingly open to change and a labor market with plenty of movement.
- More than half of U.S. employees are currently watching for or actively seeking new job opportunities.
- At 51%, this makes it the highest level since 2015.
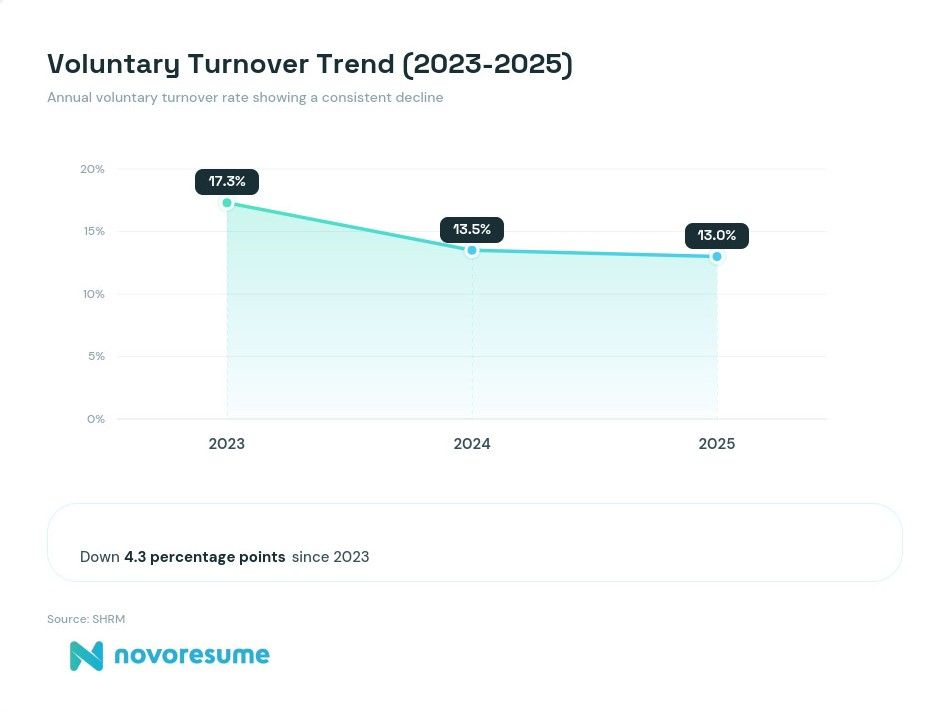
- The average voluntary turnover rate in the U.S. is 13.0% as of 2025.
- Voluntary turnover has steadily declined over the past few years. It’s gone from 17.3% in 2023 to 13.5% in 2024 to 13.0% in 2025.
- Approximately 3.2 million Americans quit their jobs in November 2025 alone.
- The national quit rate sits at 2.0%, meaning about 2 in every 100 employees voluntarily left their jobs that month.
- There are currently 7.1 million job openings nationwide.
- However, that means job openings are down by 885,000 compared to the previous year.
- The total separation rate (including quits, layoffs, and other departures) is 3.2% nationally.
- The median employee tenure in the U.S. is 4.1 years. It’s a number that has remained relatively flat since 2018.
- More than 4 in 10 organizations report difficulty hiring or retaining employees for certain roles.
13 Employee Turnover Rates by Industry
Turnover rates vary dramatically depending on where you work. If you're considering a career change, it helps to know which industries experience the most turnover and which retain employees longer.
- Leisure and hospitality has the highest total separations rate at 5.8% per month.
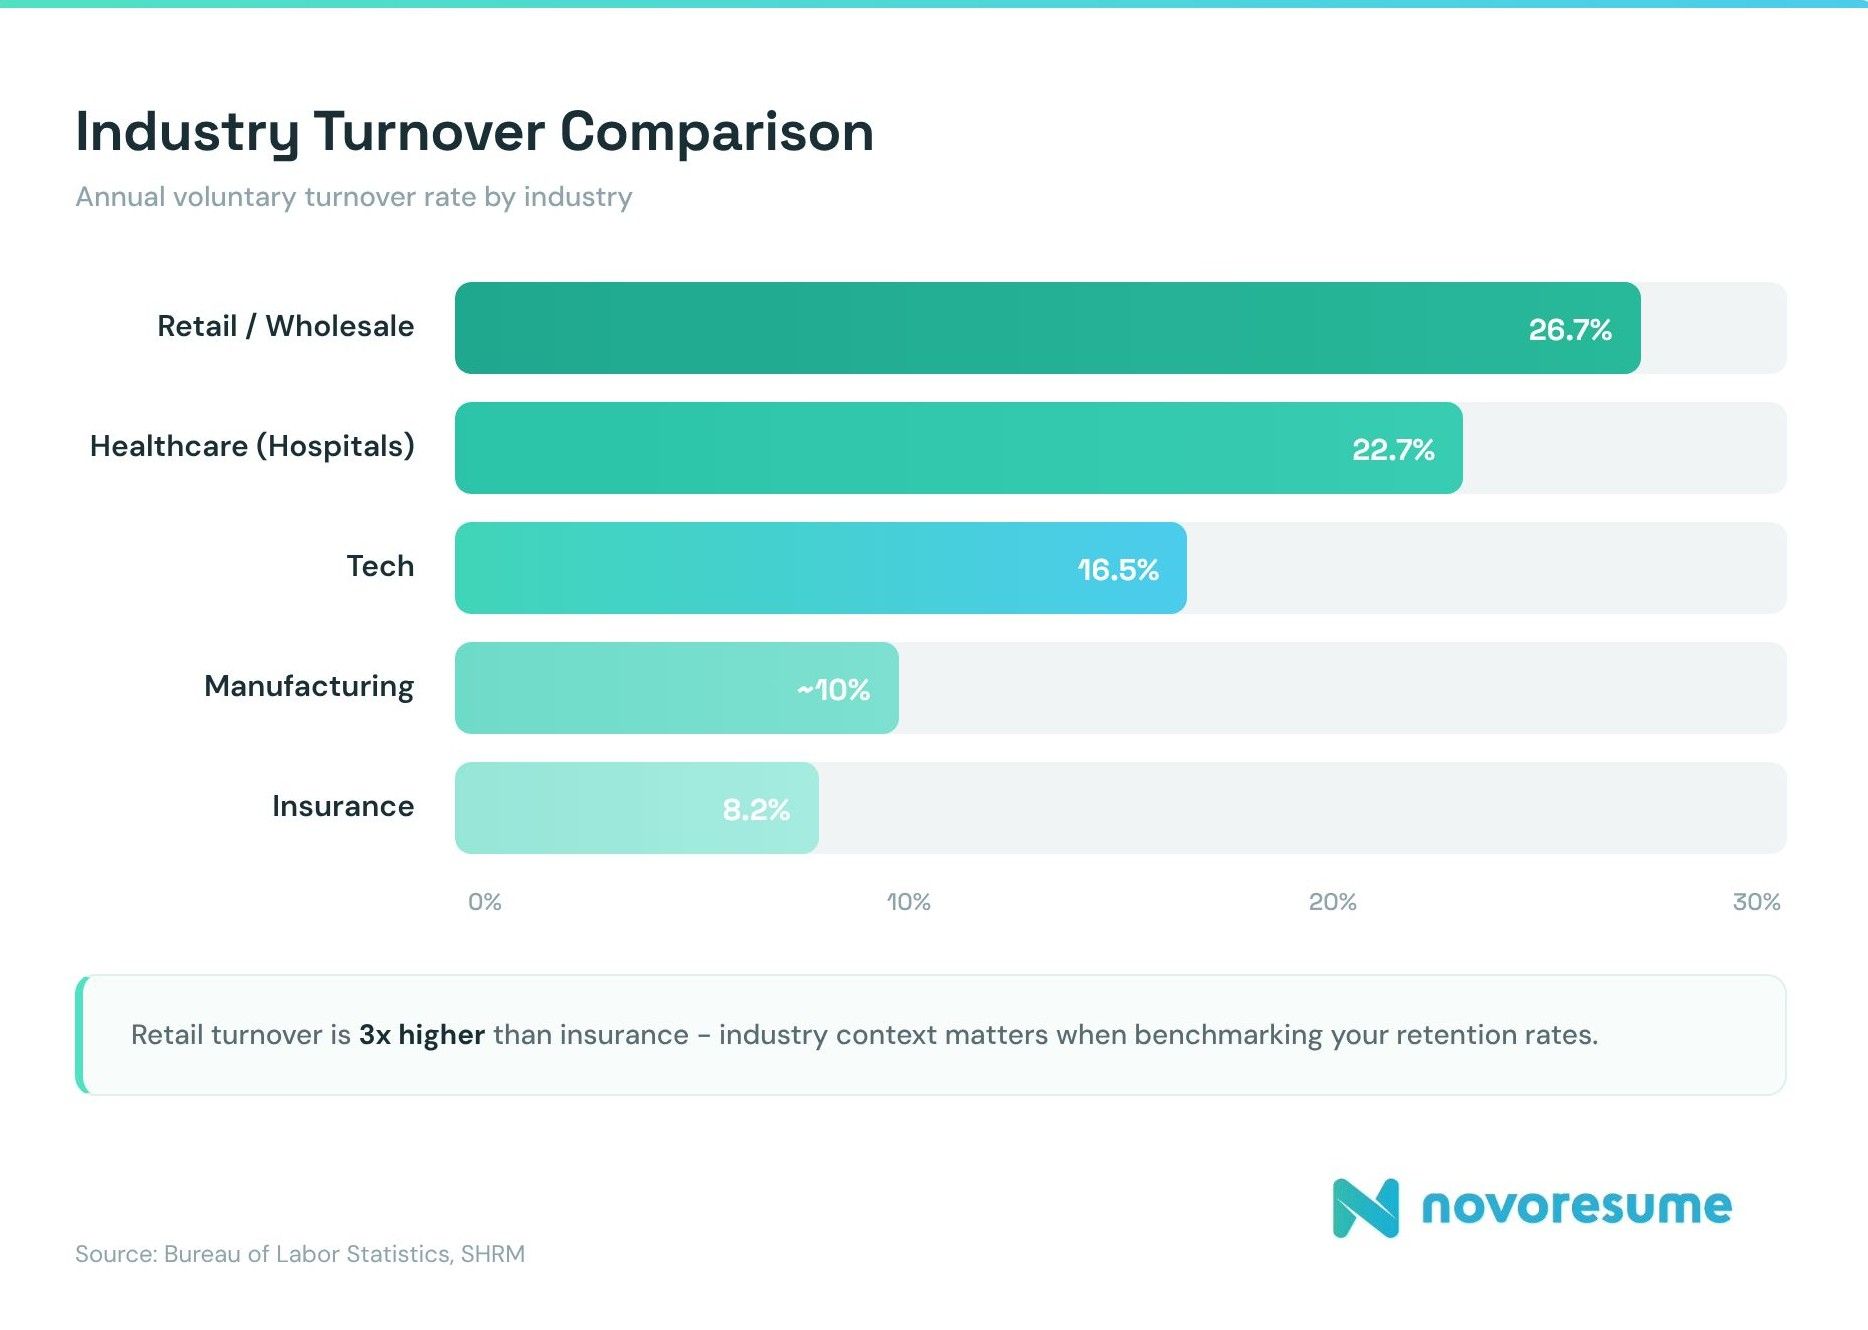
- Retail and wholesale have the highest annual voluntary turnover rate at 26.7%.
- At just 8.2%, insurance has the lowest annual voluntary turnover rate.
- Government jobs have the lowest monthly separation rate at about 1.2%.
- Accommodation and food services have the highest monthly quits rate at almost 5%.
- That’s almost five times the government's quit rate, which is 0.7%.
- Arts, entertainment, and recreation have a 6.6% total separations rate.
- Financial activities also have one of the lowest separation rates, with 2.1% per month.
- Professional and business services have a total monthly separation rate of 4.6%.
- The entire information sector, which includes many tech jobs, has a 3.0% monthly separation rate.
- Manufacturing holds steady with an average monthly separations rate of 2.5%.
- This industry also has the highest median tenure - manufacturing workers stay with the same employer for about 5.1 years.
- Meanwhile, median tenure is lowest in leisure and hospitality at just 2.3 years.
7 Healthcare Turnover Statistics
Healthcare continues to face unique retention challenges driven by burnout and staffing shortages.
- The national hospital turnover rate in the U.S. is 22.7%.
- Healthcare services rank among the top industries reporting difficulty filling roles.
- While that means over one in five healthcare professionals quit, this is down 3.2 percentage points from 2022.
- The nursing vacancy rate stands at 15.7%.
- The average U.S. hospital lost $8.55 million to turnover costs in 2022.
- It costs an average of $52,000 to replace a single nurse.
- It takes approximately 90 days to fill an open hospital position.
6 Retail and Hospitality Turnover Statistics
If you work in retail, food service, or hospitality, you're in one of the most volatile job markets out there. High turnover can mean more opportunities but also less stability.
- More than one in four employees will quit retail and wholesale within a year.
- Accommodation and food services have a monthly quits rate of 4.8%.
- That’s more than double the national average of 2%.
- If you round up, approximately 57% of the accommodation and food services workforce turnover in a year.
- The leisure and hospitality sector accounts for almost 6% in the total separations rate.
- But retail trade has a 2.7% monthly quit rate, which is considerably lower than the category average.
10 Technology Turnover Statistics
Tech has seen significant setbacks in recent years, with waves of layoffs accompanying continued demand for skilled workers.
- This sector saw the biggest increase in voluntary turnover. This past year, it went from 16% to 16.5%.
- For reference, the tech industry had a 13.2% turnover rate in 2022, higher than retail's at the time.
- The gaming sector experienced even higher turnover at 15.5% in 2022.
- The information sector as a whole currently has a 3.0% monthly separation rate.
- About 66% of tech candidates expect to look for a new role in the next 12 months.
- That’s down from 85% in 2024 and shows a significant shift - more tech workers are "job-hugging" rather than job-hopping.
- The entire information sector's quit rate is just 1.1%, which is almost half the national average.
- According to various sources, in 2024-2025 alone, close to 397,000 tech employees were laid off.
- The average tenure in tech is just 2-3 years, while for software engineers specifically, it's closer to 2 years.
- The first year, however, is mostly training, as it takes approximately eight months for a new tech employee to become fully productive.
7 Turnover Statistics by Job Level and Role
Your position in the company hierarchy can significantly affect your likelihood of leaving and your coworkers' likelihood of leaving. Generally, the higher you climb, the more likely you are to stay at the same company.
- Executive roles have the lowest voluntary turnover rate at just 5.2%.
- However, management positions have a higher voluntary turnover rate of 8.7%.
- Professional-level employees have an 11.1% turnover rate.
- Across roles, sales representatives have some of the highest turnover, at 14.4%.
- But administrative positions aren't far behind, at 14.3%.
- Blue-collar and para-professional workers account for 12.5%, placing in the middle.
- Production, maintenance, service, and trades employees account for 28.4% of all turnover, the highest share of any job category.
12 Statistics On the Cost of Employee Turnover
Understanding what it actually costs to replace an employee can help you negotiate better and help you see why some employers invest so heavily in employee retention.
- 87% of companies underestimate the true cost of turnover.
- On average, replacing an employee costs about 33% of their annual salary.
- But that varies dramatically by level. It’s about 200% of salary for leaders and managers.
- Technical professionals, like engineers, are at 80%.
- But frontline workers, such as warehouse or manufacturing workers, cost about 40%.
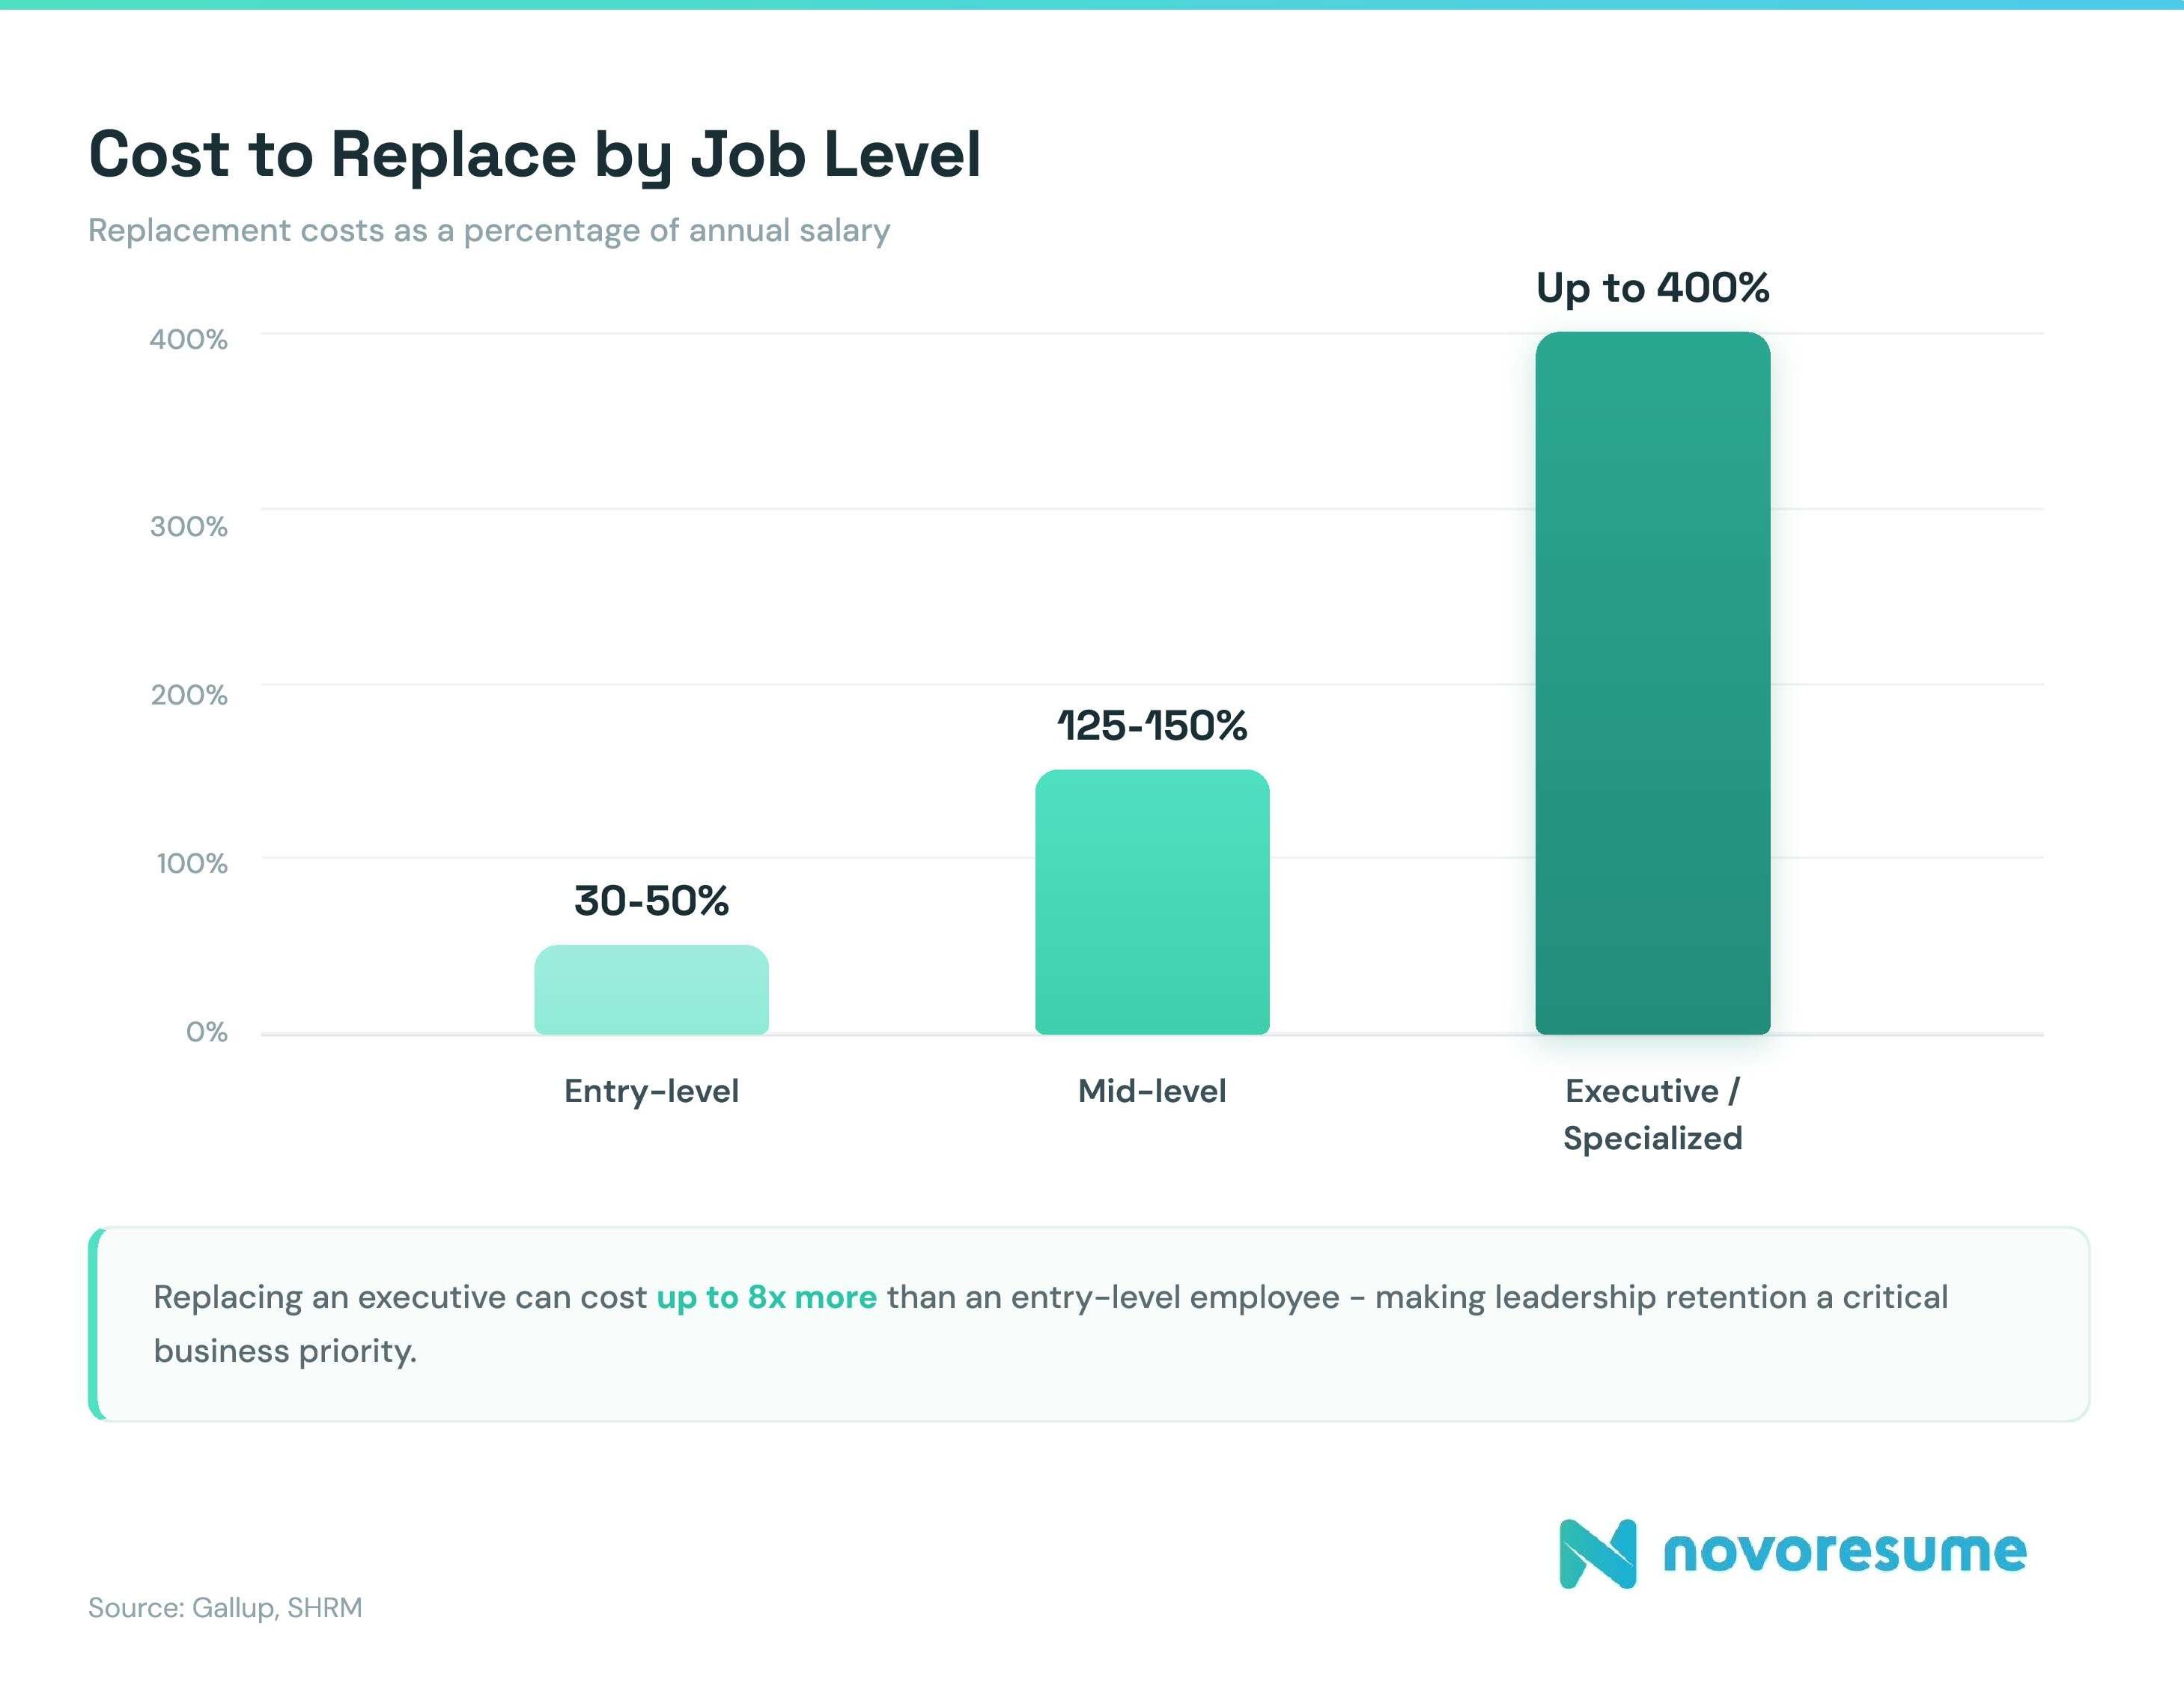
- Entry-level positions cost 30-50% of the annual salary to replace.
- Mid-level employees cost nearly three times as much to replace, ranging from 125% to 150% of their salary.
- Highly specialized or executive roles can cost up to 400% of annual salary.
- Employee turnover costs U.S. businesses an estimated $1 trillion every year.
- A 100-person company with an average salary of $50,000 could face turnover costs exceeding $2 million annually.
- It takes an average of 6.2 months for companies to break even on a new managerial hire.
- And 68% of turnover costs occur within the first 90 days after an employee leaves.
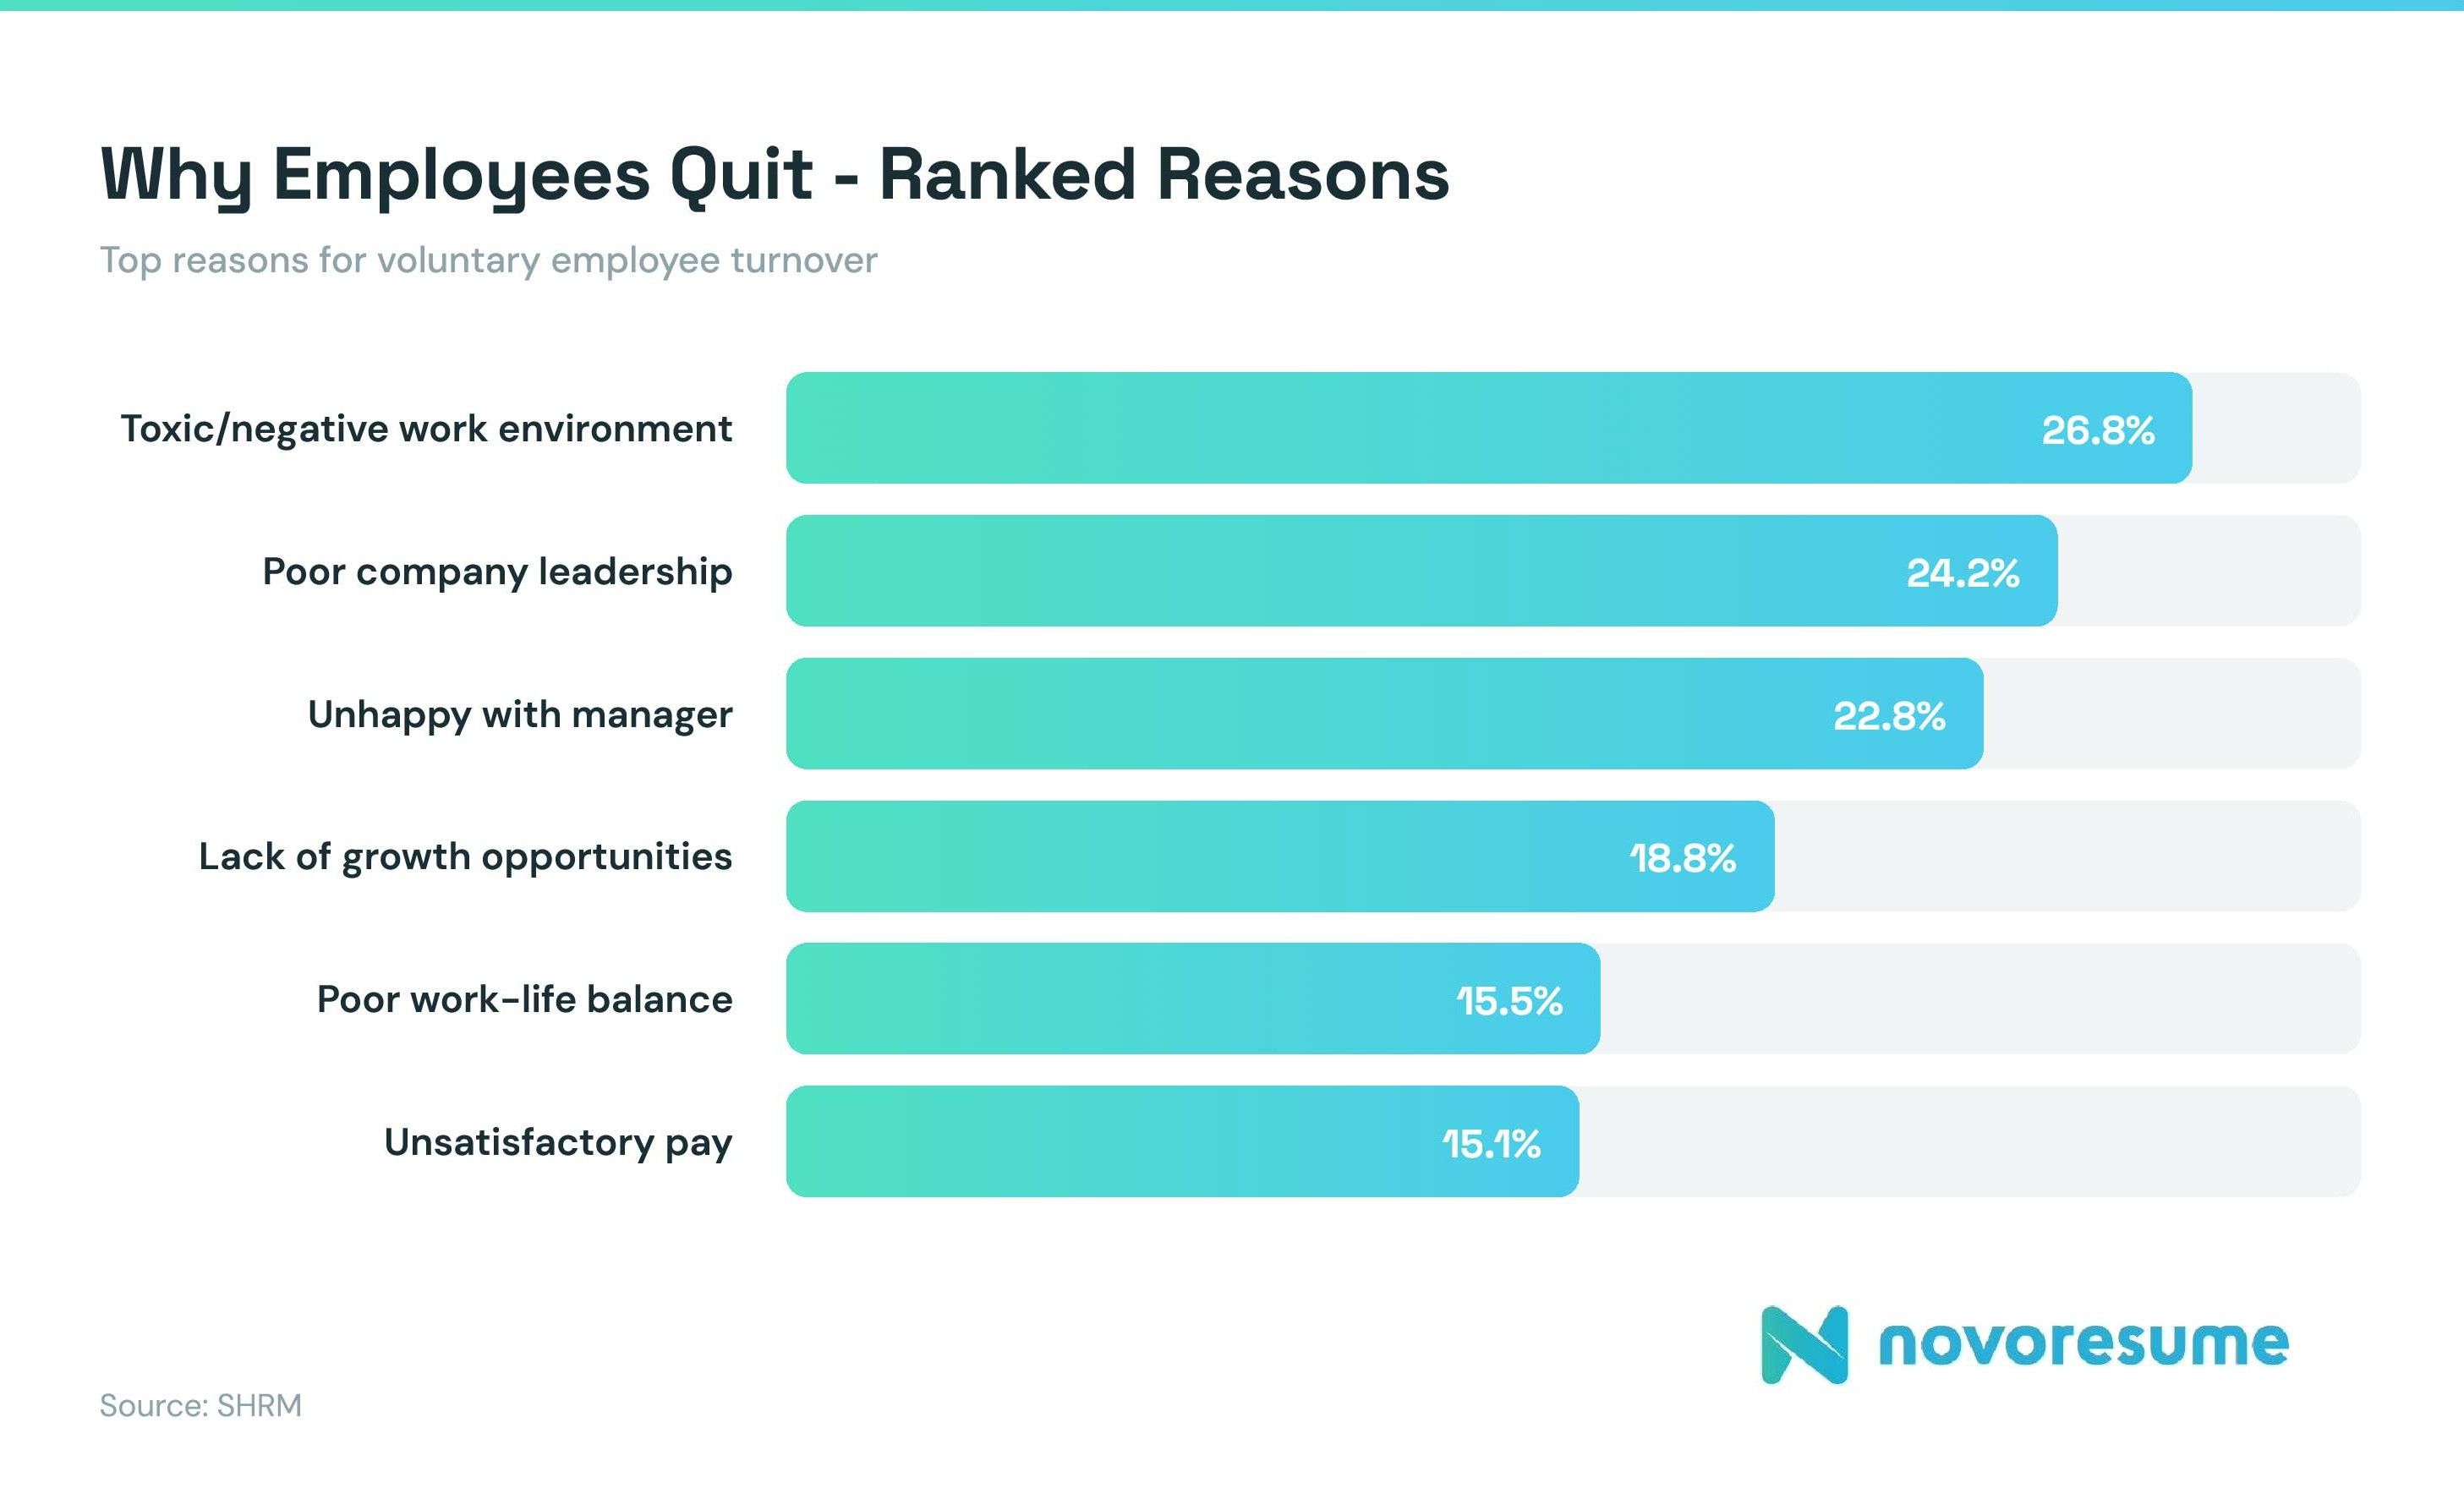
10 Statistics on Why Employees Quit
If you're thinking about quitting your job, it might be because of a popular reason. Here's what the data says about why most employees decide to move on.
- 26.8% of employees cited a toxic or negative work environment as the top reason they quit in the past year.
- Poor company leadership came in second at 24.2%.
- Being unhappy with a manager or supervisor was third at 22.8%.
- A lack of growth opportunities accounted for 18.8% of departures, up from the previous year.
- Poor work-life balance accounted for 15.5% of exits.
- Surprisingly, unsatisfactory pay was behind 15.1% of voluntary turnover.
- At the same time, burnout and stress were cited by another 15.1%.
- Concerns about job security accounted for 14.6% of quits, up from the previous year.
- 45% of employees who quit said that no one, not even their manager, discussed their job satisfaction or a future with them in the three months before they left.
- Among Gen Z workers, 49% plan to leave their job within the next two years.
9 Preventable Turnover Statistics
Most turnover rates are preventable. If you're feeling undervalued or overlooked, these stats show you're not alone and that employers can retain talent if they know what to change.
- Research indicates that between 42% and 75% of voluntary employee turnover can actually be avoided.
- 77% of voluntary leavers either quit within three months of starting their job search or didn't actively search at all before leaving.
- Employees are four times more likely to leave if they work under a poorly rated manager.
- On the flip side, great managers reduce the likelihood of departure by 40%.
- Good onboarding makes a difference: 69% of employees stay at their jobs for at least three years when onboarding is done well.
- But only 12% of employees say their organization does a great job of onboarding.
- Well-designed mentorship programs increase retention by 50%.
- Employees stay 41% longer at companies that prioritize internal recruitment compared to those that primarily hire externally.
- Highly engaged employees are 87% more likely to stay at their jobs.
10 Employee Retention and Engagement Statistics
Employee engagement is one of the strongest predictors of whether someone stays or goes. Here's what the data shows about the relationship between employee sentiment and tenure.
- More than 51% of U.S. employees are actively or passively searching for new job opportunities.
- That's up from 44% in March 2020, indicating a steady rise in job-seeking behavior.
- At the same time, only 36% of employees are engaged in their work.
- Disengaged employees are nearly three times more likely to leave for a better work culture.
- Organizations with strong engagement programs, including career growth opportunities, achieve 59% lower turnover.
- Highly engaged employees show 84% retention rates.
- Over 70% of employees say frequent recognition would help them stay at their job longer.
- 94% of employees say they would stay longer at a company that invests in their learning and development.
- In sum, disengagement reduces productivity, costing the global economy $438 billion annually.
- Now, 57% of CEOs rank retaining and engaging employees as a top business priority.
13 Remote Work and Turnover Statistics
The relationship between where people work and how long they stay is one of the defining workforce dynamics of the decade. Here's what the numbers reveal about remote work, flexibility, and employee retention.
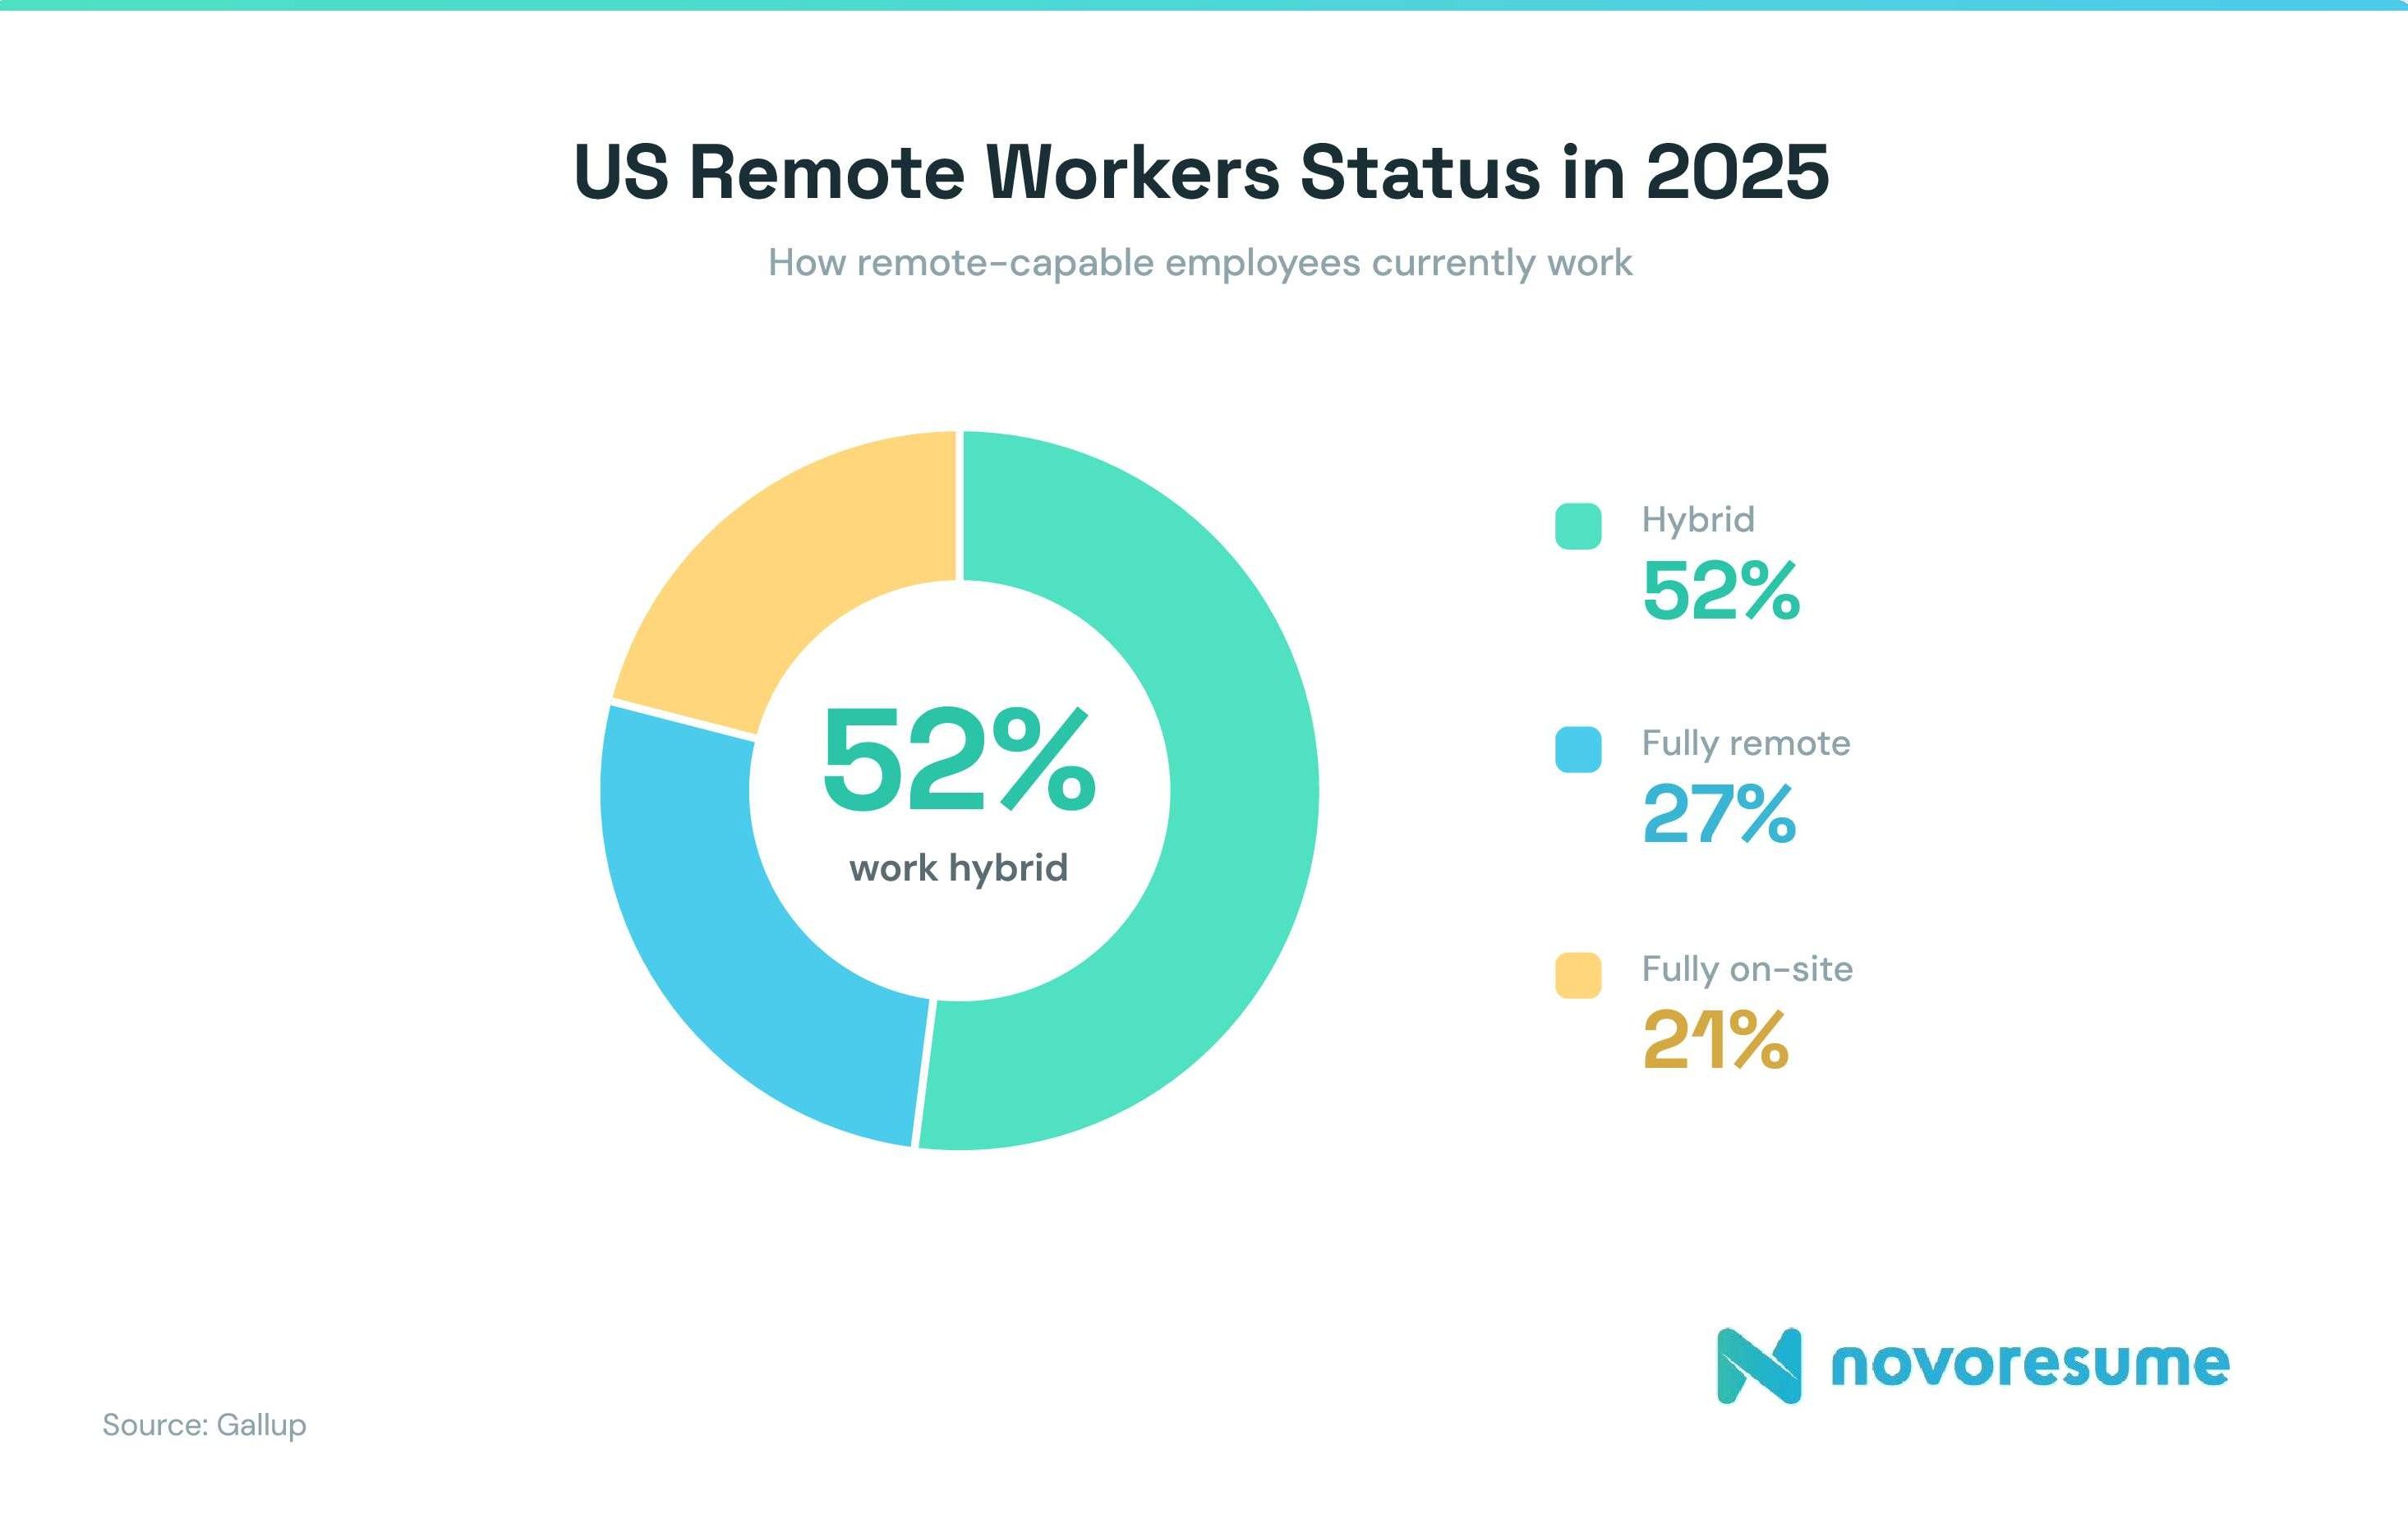
- 52% of employees whose jobs can be done remotely currently work hybrid environment.
- Of the remaining 48%, 27% work fully remote, and only 21% are fully on-site.
- Fully remote workers have a 94.2% retention rate, compared to 81.6% for office-based employees.
- That gap is more than 12 percentage points, but it also shows that having office-based work isn’t the biggest dealbreaker.
- Overall, companies that offer remote or hybrid work experience have up to 25% lower turnover than those that require full-time office attendance.
- From the employee side, 76% of workers say having flexibility in when and where they work directly influences their desire to stay with an employer.
- In fact, 46% of workers who currently work from home at least sometimes say they would be somewhat or very unlikely to stay if their employer removed remote work entirely.
- Researchers have quantified this preference: workers value hybrid arrangements as equivalent to an 8% salary increase.
- Companies that have implemented strict return-to-office mandates experience annual turnover rates 13-14% higher than those that support flexible work.
- However, 42% of companies with return-to-office mandates have experienced higher-than-anticipated employee attrition.
- Employees most likely to leave after a return-to-office mandate are often the most valuable: senior employees, highly skilled workers, and top performers who have the most options in the job market.
- 83% of workers say a hybrid setup is their ideal.
- Yet only about one-third of job postings currently offer remote or hybrid options, meaning companies that do offer flexibility have a significant advantage in attracting talent.
Conclusion
According to the data, employee turnover follows predictable patterns. People leave toxic cultures, poor managers, and dead-end roles. They stay for growth opportunities, recognition, and flexibility.
For job seekers, these can help them look beyond salary and evaluate management quality, development opportunities, and work flexibility. Monitor how current employees discuss leadership and culture on company review sites.
The statistics also reveal what you can leverage. Industries with high turnover are actively competing for talent, and employers know that replacing you is expensive and time-consuming.
The more you understand why people leave, the better equipped you are to find a place worth staying.
Related posts

Job Interviews & Find A Job
Discover the best US cities for digital nomads in 2026, with Las Vegas ranking #1 for affordability, sunshine, airport access and remote-work essentials.

Job Interviews & Find A Job
Want an online job but don't know where to start? Check out our article for a list of the best online jobs, top job boards, and tips on how to apply!

Job Interviews & Find A Job
Get ready for your job hunt with these 19 reasons for leaving a job and a guide on how to talk about it during job interviews.