
Contents
ChatGPT launched on November 30, 2022. This study looks at what has happened to US call-center jobs since then, nationally and in the big call-center hubs and states that US Bureau of Labor Statistics (BLS) data lets us measure.
We used BLS's Quarterly Census of Employment and Wages (QCEW), which counts the jobs employers report in every county and industry. In this study, call-center jobs are jobs in the call-center industry (NAICS 56142, private employers only): outsourced call centers and stand-alone contact centers. In-house customer service teams at banks, insurers, airlines and telecom firms are usually counted in those firms' own industries, so they are not in these figures.
We compare annual average call-center jobs in 2022 with 2025 (November 2022 with November 2025 for the national figure) and rank 37 metro hubs, 37 states and 38 counties, each with at least 2,000 call-center jobs in 2022, steepest fall first.
Key Findings
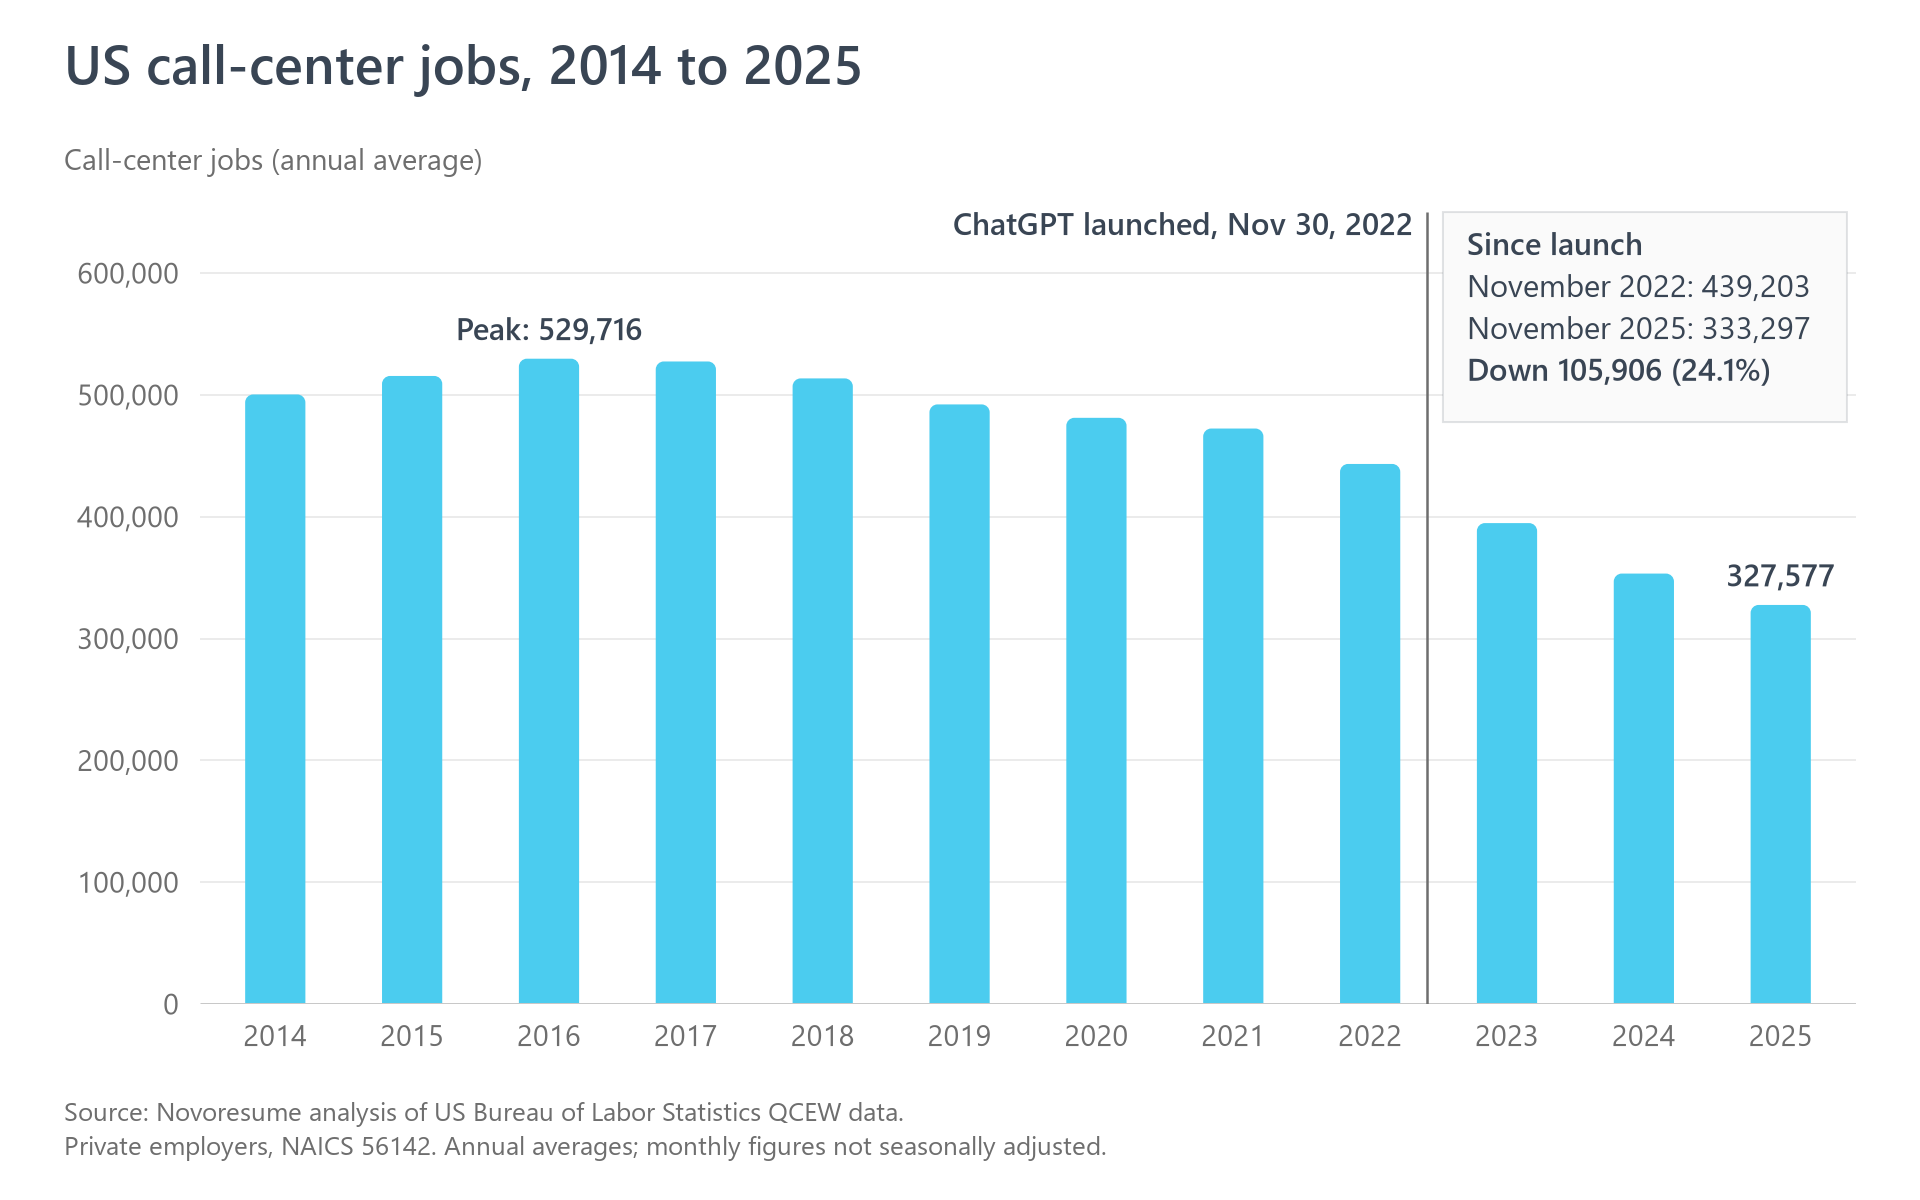
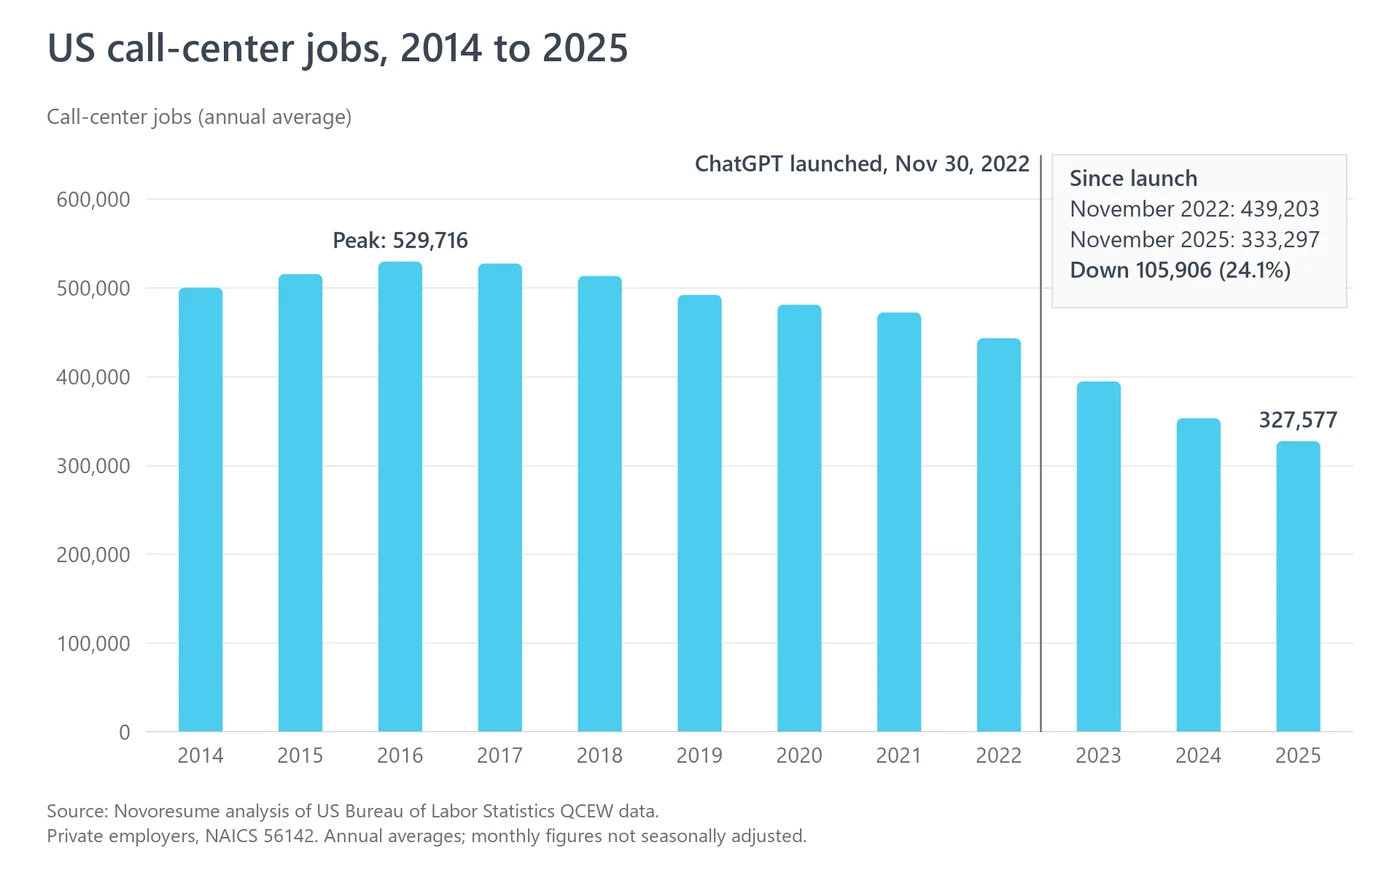
Nearly 1 in 4 US call-center jobs have gone since ChatGPT launched. There were 439,203 in November 2022 and 333,297 in November 2025, a fall of 105,906 (24.1%), while private jobs outside the industry grew 2.6%. The decline started before ChatGPT: call-center jobs peaked in 2016 (529,716) and have shrunk every year since 2017.
Of the 37 hubs we can measure (2,000+ call-center jobs in 2022), 36 shrank, including all 13 hubs with 5,000+, and the median hub lost 30.5%.
San Antonio lost 58.1% of its call-center jobs, the steepest fall of the 13 biggest hubs. It had 9,512 in 2022 and 3,984 in 2025. A one-month drop in January 2024 (2,033 jobs) equals 37% of that fall.
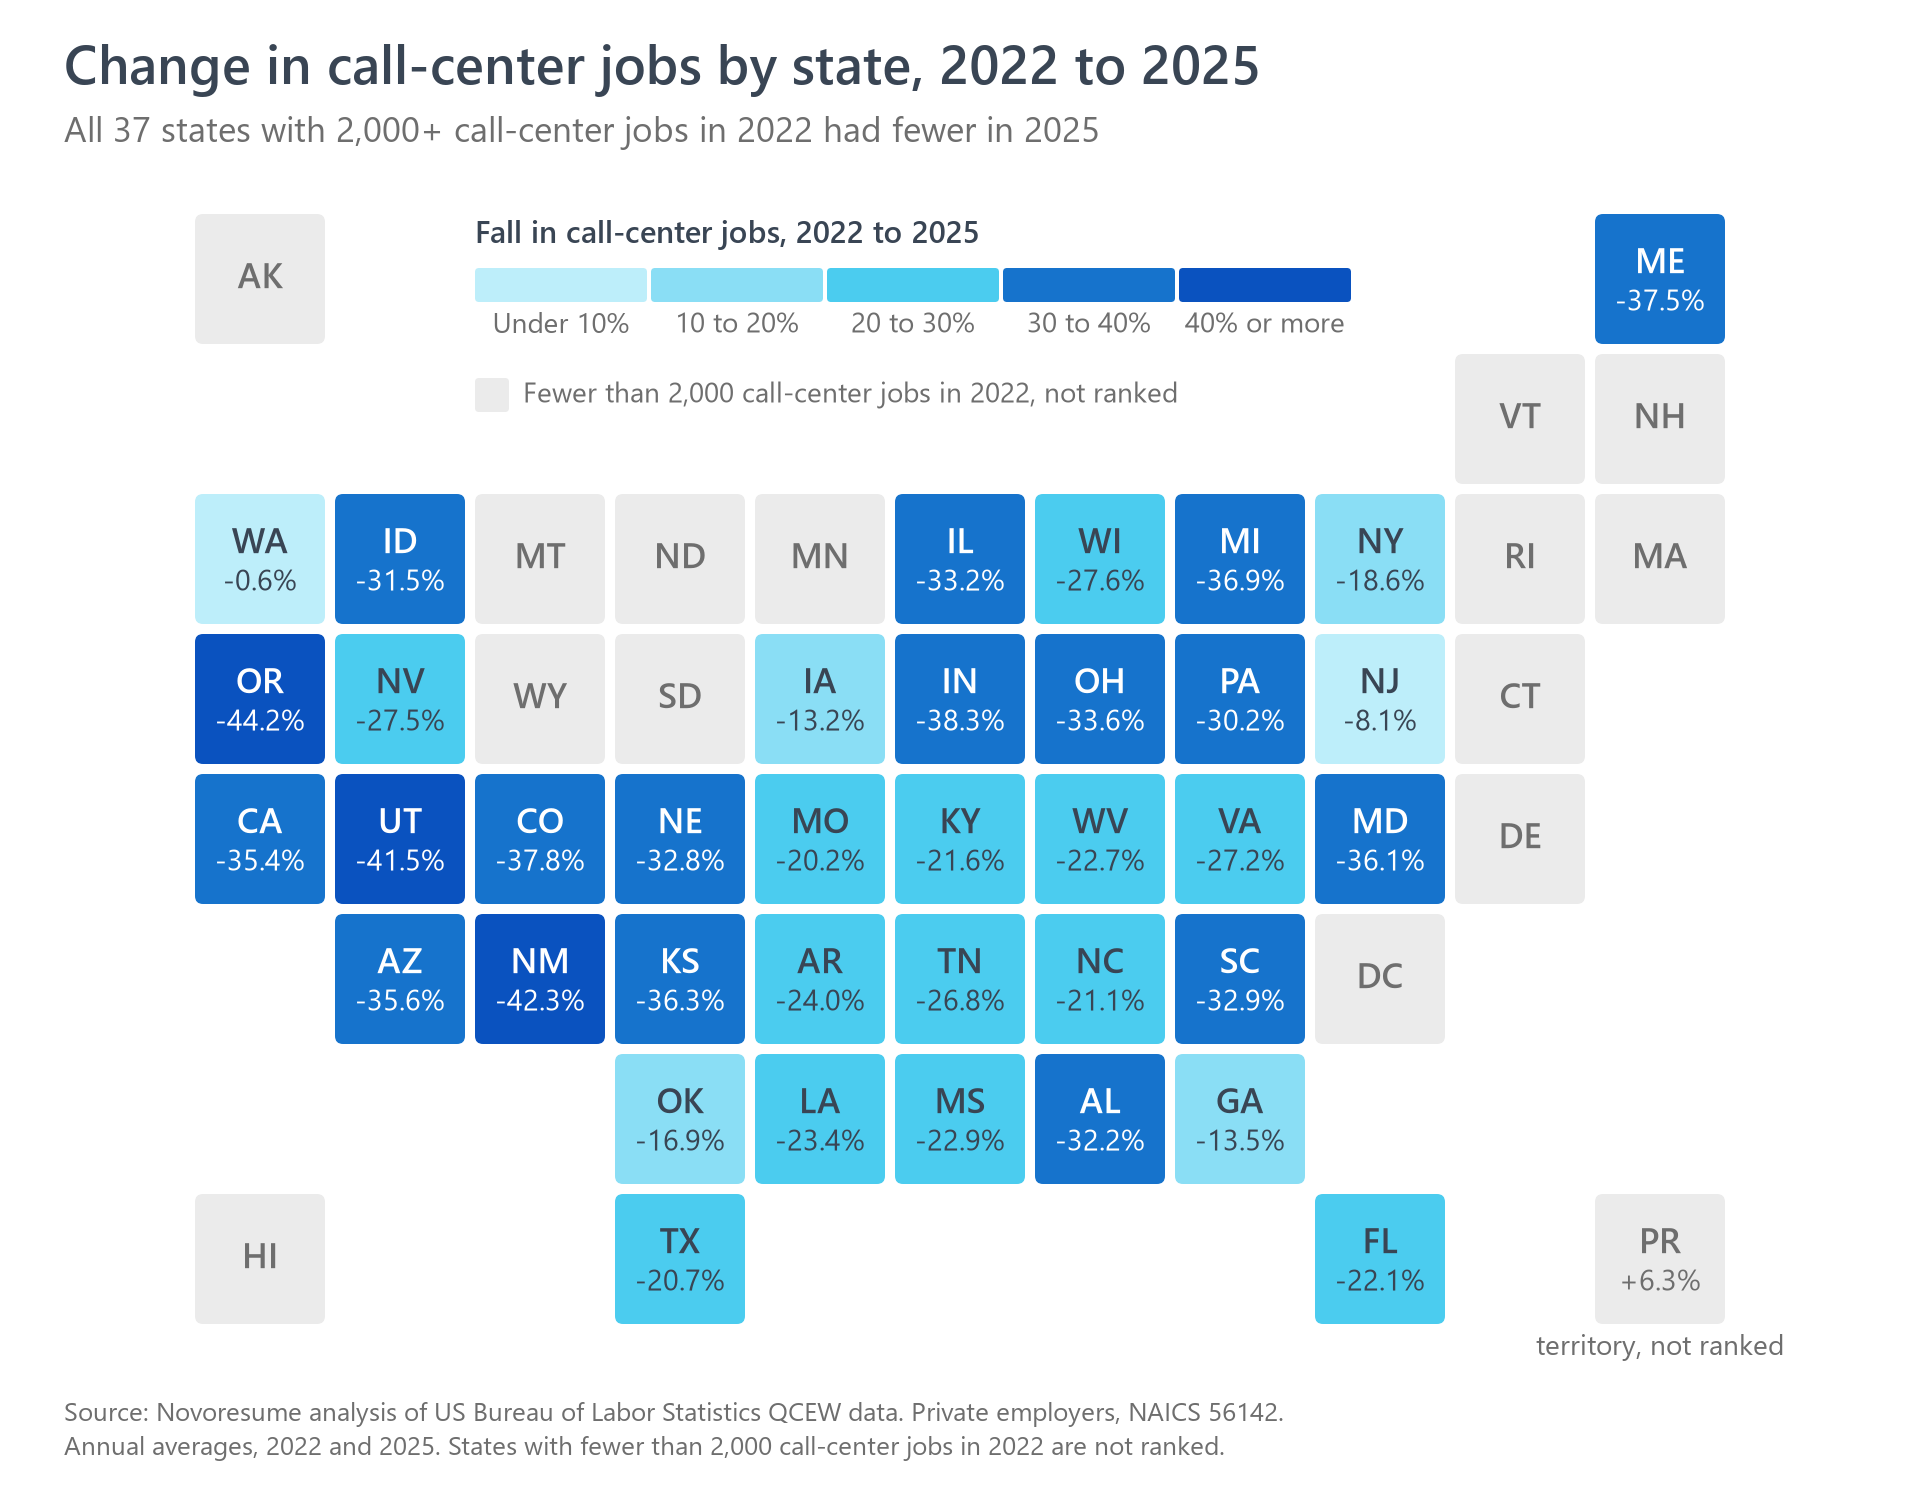
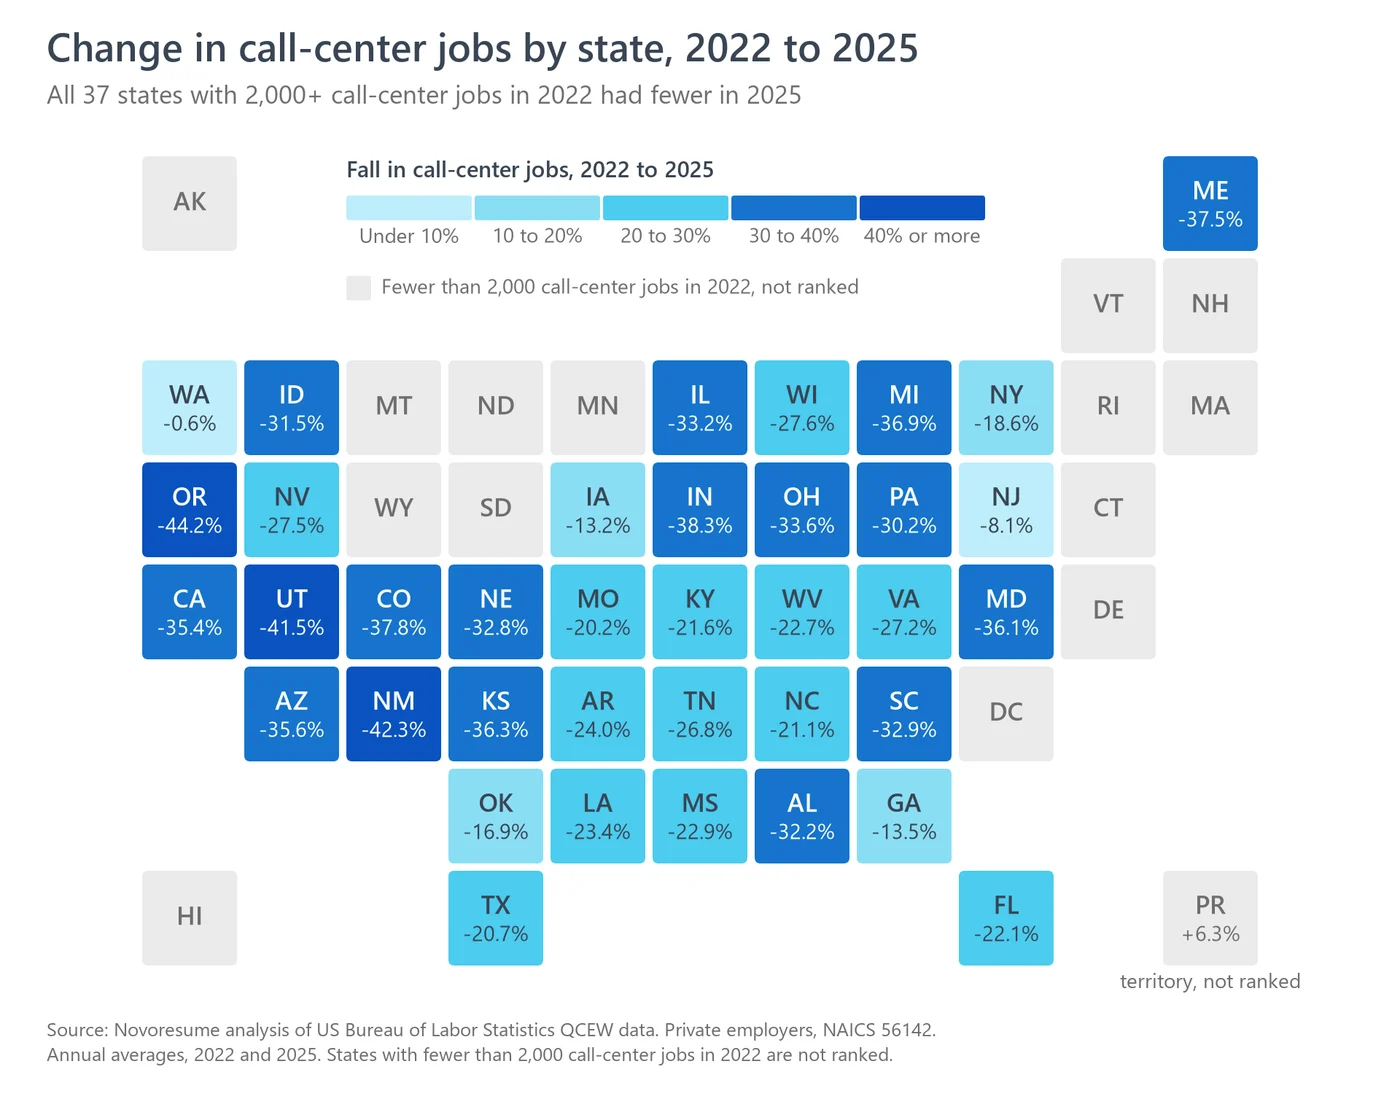
All 37 states with 2,000+ call-center jobs in 2022 had fewer in 2025. Among them, Oregon fell most (down 44.2%), then New Mexico (42.3%) and Utah (41.5%). Oregon and Utah were already down 33.9% and 36.2% from 2019 to 2022.
Call-center workplaces with 250+ staff fell by 44%, from 458 to 257 between the first quarter of 2022 and the first quarter of 2026. Call-center jobs at those workplaces fell from 270,564 to 145,052.
US Call-Center Jobs Since ChatGPT
From November 2022, the month ChatGPT launched, to November 2025, US call-center jobs fell from 439,203 to 333,297. That is 105,906 fewer call-center jobs, a fall of 24.1%, or nearly 1 in 4. Over the same months, private jobs outside the industry grew 2.6%. QCEW counts jobs, not causes: offshoring, lost contracts and remote work all ran over the same years, and the decline started in 2017.
On annual averages, the US had 443,316 call-center jobs in 2022 and 327,577 in 2025, a fall of 115,739 (26.1%). All private jobs grew 3.5% over the same years, and private jobs outside the industry grew 3.6%.
Year on year, call-center jobs fell by 6.2% in 2022, 11.0% in 2023, 10.5% in 2024 and 7.3% in 2025. They made up 3.4 of every 1,000 private jobs in 2022 and 2.5 in 2025.
The fall continued into 2026. In the first quarter of 2026 the industry averaged 309,768 jobs, 8.3% fewer than in the first quarter of 2025 (337,906).
Both parts of the industry shrank between 2022 and 2025. Jobs at contact centers (NAICS 561422) fell from 404,934 to 294,253 (down 27.3%), and jobs at telephone answering services (NAICS 561421) fell from 38,382 to 33,324 (down 13.2%).
The Fall Started Before ChatGPT
US call-center jobs peaked in 2016 at 529,716, when they made up 4.4 of every 1,000 private jobs. They have shrunk every year since 2017 and fell 9.9% from 2019 to 2022. The fall sped up during 2022, before ChatGPT launched. Call-center jobs fell 6.6% between January and November 2022. The same months moved by only 0.3% in 2017 and 0.6% in 2018.
Big Call-Center Workplaces Fell by 44%
In the first quarter of 2022, 458 call-center workplaces had 250 or more staff. By the first quarter of 2026, 257 did, a fall of 44%. Call-center jobs at those workplaces fell from 270,564 to 145,052 (down 46.4%), and workplaces with 1,000 or more staff went from 49 to 27. The count was already falling before 2022: in 2016 there were 583 workplaces with 250 or more staff.
These are BLS reporting units sized by March headcount, not buildings. Remote work can move staff off a big unit on paper. From 2016 to 2026 the total number of call-center units rose, but that rise was entirely in units with fewer than 10 staff. Employers report remote agents in another state as separate units, often with no county.
The 13 Biggest US Call-Center Hubs
These are the 13 metro hubs with 5,000 or more call-center jobs in 2022 that BLS data lets us measure. All 13 had fewer call-center jobs in 2025 than in 2022.
San Antonio fell furthest, down 58.1% from 9,512 to 3,984 call-center jobs. A one-month drop in January 2024 (2,033 jobs) equals 37% of that fall.
Albuquerque lost about half its call-center jobs (down 50.8%, from 5,237 to 2,575). Albuquerque's call-center jobs had already fallen 19.8% from 2019 to 2022. That earlier fall came in Sandoval County (3,453 to 1,563). Bernalillo County, home to the city of Albuquerque, grew 19.2% over the same years (Table 4). Albuquerque's 2022 to 2025 loss equals 8.5 of every 1,000 private jobs in the metro, the highest share of any hub we can measure.
Las Vegas call-center jobs barely moved from 2019 to 2022 (down 1.6%), then fell by 4,479 (30.5%) from 2022 to 2025.
New York, Atlanta and Philadelphia also had more than 5,000 call-center jobs in 2022 on BLS's own metro totals (7,929, 6,135 and 5,336). BLS hides part of their county data, so they are not on this list.
| Rank | Hub (metro area) | 2022 | 2025 | Change | % change, 2022 to 2025 | % change, 2019 to 2022 | Loss per 1,000 private jobs |
|---|---|---|---|---|---|---|---|
| 1 | San Antonio-New Braunfels, TX | 9,512 | 3,984 | -5,528 | +4.6% | 6.1 | |
| 2 | Albuquerque, NM | 5,237 | 2,575 | -2,662 | -19.8% | 8.5 | |
| 3 | Tucson, AZ | 5,359 | 3,310 | -2,049 | -39.0% | 6.6 | |
| 4 | Phoenix-Mesa-Chandler, AZ | 14,749 | 9,224 | -5,525 | -25.7% | 2.7 | |
| 5 | Salt Lake City-Murray, UT | 5,209 | 3,490 | -1,719 | -32.6% | 2.5 | |
| 6 | Las Vegas-Henderson-North Las Vegas, NV | 14,681 | 10,202 | -4,479 | -1.6% | 4.7 | |
| 7 | Dallas-Fort Worth-Arlington, TX | 15,034 | 10,557 | -4,477 | +2.2% | 1.3 | |
| 8 | Tampa-St. Petersburg-Clearwater, FL | 8,915 | 6,318 | -2,597 | -27.4% | 2.1 | |
| 9 | Chicago-Naperville-Elgin, IL-IN | 5,381 | 4,007 | -1,374 | -8.9% | 0.4 | |
| 10 | Miami-Fort Lauderdale-West Palm Beach, FL | 12,811 | 10,536 | -2,275 | -17.4% | 1.0 | |
| 11 | Orlando-Kissimmee-Sanford, FL | 9,609 | 8,408 | -1,201 | -23.2% | 1.0 | |
| 12 | Oklahoma City, OK | 5,467 | 4,959 | -508 | +28.6% | 1.0 | |
| 13 | El Paso, TX | 7,777 | 7,419 | -358 | +3.0% | 1.4 |
Annual average call-center jobs, ranked by percentage change from 2022 to 2025. Loss per 1,000 private jobs divides the 2022 to 2025 fall by all private jobs in the hub in 2022.
San Antonio, Phoenix and Dallas-Fort Worth each include one of five counties that together lost 8,781 call-center jobs in January 2024 with no matching layoff notice and no known cause; the figures keep that drop.
Call-Center Jobs by Metro Hub: 37 Hubs Ranked
This table ranks every metro hub with at least 2,000 call-center jobs in 2022 that BLS data lets us measure. Of the 37, 36 had fewer call-center jobs in 2025 than in 2022, and the median hub lost 30.5%.
| 1 | San Antonio-New Braunfels, TX | 9,512 | 3,984 | -5,528 | +4.6% | 10.6 to 4.2 | Partial (94%) | |
|---|---|---|---|---|---|---|---|---|
| 2 | Columbia, SC | 2,225 | 934 | -1,291 | -13.3% | 7.3 to 2.9 | Partial (79%) | |
| 3 | Columbus, OH | 2,555 | 1,221 | -1,334 | -40.0% | 2.8 to 1.3 | Unchecked | |
| 4 | Albuquerque, NM | 5,237 | 2,575 | -2,662 | -19.8% | 16.7 to 7.9 | Full (100%, vs BLS 2023 total) | |
| 5 | Charlotte-Concord-Gastonia, NC-SC | 2,256 | 1,169 | -1,087 | -2.4% | 2.0 to 1.0 | Partial (78%) | |
| 6 | Portland-Vancouver-Hillsboro, OR-WA | 3,502 | 1,938 | -1,564 | -30.9% | 3.3 to 1.8 | Full (100%, vs BLS 2023 total) | |
| 7 | Detroit-Warren-Dearborn, MI | 3,892 | 2,344 | -1,548 | -45.4% | 2.3 to 1.4 | Partial (86%) | |
| 8 | Richmond, VA | 2,108 | 1,277 | -831 | -14.4% | 4.0 to 2.3 | Partial (43%) | |
| 9 | Tucson, AZ | 5,359 | 3,310 | -2,049 | -39.0% | 17.3 to 10.5 | Full (100%) | |
| 10 | Phoenix-Mesa-Chandler, AZ | 14,749 | 9,224 | -5,525 | -25.7% | 7.3 to 4.3 | Full (100%) | |
| 11 | Boise City, ID | 3,458 | 2,176 | -1,282 | -12.6% | 10.8 to 6.3 | Full (99%) | |
| 12 | Greenville-Anderson-Greer, SC | 2,399 | 1,581 | -818 | -2.6% | 6.7 to 4.2 | Partial (93%) | |
| 13 | Raleigh-Cary, NC | 2,555 | 1,695 | -860 | +16.2% | 4.3 to 2.6 | Unchecked | |
| 14 | Denver-Aurora-Centennial, CO | 3,488 | 2,319 | -1,169 | -34.5% | 2.6 to 1.7 | Full (96%) | |
| 15 | Philadelphia-Camden-Wilmington, PA-NJ-DE-MD | 3,298 | 2,204 | -1,094 | +4.9% | 1.3 to 0.9 | Partial (62%) | |
| 16 | Salt Lake City-Murray, UT | 5,209 | 3,490 | -1,719 | -32.6% | 7.6 to 4.9 | Full (100%) | |
| 17 | Virginia Beach-Chesapeake-Norfolk, VA-NC | 2,527 | 1,706 | -821 | -24.0% | 4.3 to 2.8 | Partial (68%) | |
| 18 | Jacksonville, FL | 2,443 | 1,672 | -771 | +10.8% | 3.8 to 2.5 | Full (98%) | |
| 19 | Las Vegas-Henderson-North Las Vegas, NV | 14,681 | 10,202 | -4,479 | -1.6% | 15.4 to 9.9 | Full (100%) | |
| 20 | Huntsville, AL | 2,208 | 1,543 | -665 | -5.2% | 11.4 to 7.3 | Unchecked | |
| 21 | Dallas-Fort Worth-Arlington, TX | 15,034 | 10,557 | -4,477 | +2.2% | 4.4 to 2.9 | Full (99%) | |
| 22 | Tulsa, OK | 2,548 | 1,790 | -758 | -39.9% | 6.7 to 4.5 | Full (98%) | |
| 23 | Tampa-St. Petersburg-Clearwater, FL | 8,915 | 6,318 | -2,597 | -27.4% | 7.2 to 4.9 | Full (100%) | |
| 24 | Chicago-Naperville-Elgin, IL-IN | 5,381 | 4,007 | -1,374 | -8.9% | 1.4 to 1.0 | Full (96%) | |
| 25 | Little Rock-North Little Rock-Conway, AR | 2,452 | 1,832 | -620 | -9.6% | 8.9 to 6.3 | Unchecked | |
| 26 | Nashville-Davidson-Murfreesboro-Franklin, TN | 2,987 | 2,273 | -714 | -19.1% | 3.2 to 2.3 | Partial (87%) | |
| 27 | Springfield, MO | 2,335 | 1,784 | -551 | -22.0% | 12.6 to 9.3 | Full (98%) | |
| 28 | Palm Bay-Melbourne-Titusville, FL | 2,348 | 1,850 | -498 | +0.5% | 11.5 to 8.6 | Full (100%) | |
| 29 | Los Angeles-Long Beach-Anaheim, CA | 4,878 | 3,929 | -949 | -21.7% | 0.9 to 0.7 | Full (100%) | |
| 30 | Miami-Fort Lauderdale-West Palm Beach, FL | 12,811 | 10,536 | -2,275 | -17.4% | 5.4 to 4.2 | Full (100%) | |
| 31 | McAllen-Edinburg-Mission, TX | 4,671 | 3,886 | -785 | +114.9% | 21.0 to 16.3 | Full (100%) | |
| 32 | Austin-Round Rock-San Marcos, TX | 2,411 | 2,031 | -380 | -8.0% | 2.3 to 1.8 | Unchecked | |
| 33 | Orlando-Kissimmee-Sanford, FL | 9,609 | 8,408 | -1,201 | -23.2% | 8.0 to 6.6 | Full (100%) | |
| 34 | Houston-Pasadena-The Woodlands, TX | 3,717 | 3,278 | -439 | -11.4% | 1.4 to 1.2 | Full (97%) | |
| 35 | Oklahoma City, OK | 5,467 | 4,959 | -508 | +28.6% | 10.5 to 9.0 | Full (100%) | |
| 36 | El Paso, TX | 7,777 | 7,419 | -358 | +3.0% | 30.7 to 27.5 | Full (100%) | |
| 37 | Atlanta-Sandy Springs-Roswell, GA* | 4,425 | 5,076 | +651 | +43.7% | 1.8 to 2.0 | Partial (72%) |
* Atlanta: our county figures cover 72% of BLS's own Atlanta metro total, with 19 counties hidden. BLS's own Atlanta metro total fell from 6,135 call-center jobs in 2022 to 5,329 in 2023, and BLS hides it from 2024 on.
San Antonio, Phoenix, Dallas-Fort Worth, Houston and Atlanta each include one of five counties that together lost 8,781 call-center jobs in January 2024 with no matching layoff notice and no known cause; the figures keep that drop.
Coverage compares our 2022 county figures with BLS's own metro total. Full is 95% or more, Partial is below 95%, and Unchecked means BLS published no metro total.
At least 11 more hubs with 2,000+ call-center jobs in 2022 cannot be measured, as BLS hides too many of their counties: Chattanooga, Brownsville, St. Louis, Kansas City, New York, Cincinnati, Indianapolis, Pittsburgh, Sacramento, San Juan and Shreveport.
Call-Center Jobs by State: 37 States Ranked
All 37 states with 2,000 or more call-center jobs in 2022 had fewer in 2025, and 18 of them lost 30% or more. Among them, Oregon fell most (down 44.2%), then New Mexico (42.3%), Utah (41.5%), Indiana (38.3%) and Colorado (37.8%).
Three of those five were already falling fast before 2022: from 2019 to 2022, Oregon fell 33.9%, Utah 36.2% and Colorado 38.1%. New Mexico (down 21.0%) and Indiana (down 19.7%) fell more slowly before 2022.
New Mexico's 2022 to 2025 loss equals 4.1 of every 1,000 private jobs in the state, the highest share of the 37 states. Puerto Rico, shown below the ranking for reference, had 6.3% more call-center jobs in 2025 than in 2022. BLS hides none of the states in this table in 2022 or 2025.
| 1 | Oregon | 10,090 | 6,668 | 3,718 | -2,950 | -33.9% | 4.0 to 2.2 | |
|---|---|---|---|---|---|---|---|---|
| 2 | New Mexico | 8,079 | 6,383 | 3,686 | -2,697 | -21.0% | 9.7 to 5.3 | |
| 3 | Utah | 14,354 | 9,155 | 5,353 | -3,802 | -36.2% | 6.5 to 3.6 | |
| 4 | Indiana | 8,339 | 6,699 | 4,134 | -2,565 | -19.7% | 2.5 to 1.5 | |
| 5 | Colorado | 11,231 | 6,956 | 4,326 | -2,630 | -38.1% | 2.9 to 1.8 | |
| 6 | Maine | 4,723 | 2,302 | 1,438 | -864 | -51.3% | 4.3 to 2.6 | |
| 7 | Michigan | 9,728 | 7,019 | 4,430 | -2,589 | -27.8% | 1.9 to 1.2 | |
| 8 | Kansas | 5,969 | 5,344 | 3,406 | -1,938 | -10.5% | 4.6 to 2.9 | |
| 9 | Maryland | 3,228 | 2,306 | 1,473 | -833 | -28.6% | 1.1 to 0.7 | |
| 10 | Arizona | 31,104 | 22,579 | 14,530 | -8,049 | -27.4% | 8.4 to 5.1 | |
| 11 | California | 19,411 | 13,207 | 8,535 | -4,672 | -32.0% | 0.9 to 0.5 | |
| 12 | Ohio | 19,883 | 12,073 | 8,015 | -4,058 | -39.3% | 2.6 to 1.7 | |
| 13 | Illinois | 9,280 | 8,277 | 5,530 | -2,747 | -10.8% | 1.6 to 1.1 | |
| 14 | South Carolina | 9,952 | 11,241 | 7,538 | -3,703 | +13.0% | 6.1 to 3.9 | |
| 15 | Nebraska | 5,257 | 4,193 | 2,819 | -1,374 | -20.2% | 5.1 to 3.3 | |
| 16 | Alabama | 8,863 | 9,177 | 6,219 | -2,958 | +3.5% | 5.5 to 3.6 | |
| 17 | Idaho | 8,769 | 6,860 | 4,701 | -2,159 | -21.8% | 9.8 to 6.3 | |
| 18 | Pennsylvania | 11,976 | 10,626 | 7,420 | -3,206 | -11.3% | 2.0 to 1.4 | |
| 19 | Wisconsin | 7,579 | 5,397 | 3,910 | -1,487 | -28.8% | 2.2 to 1.5 | |
| 20 | Nevada | 16,940 | 16,627 | 12,061 | -4,566 | -1.8% | 12.6 to 8.7 | |
| 21 | Virginia | 16,650 | 17,584 | 12,807 | -4,777 | +5.6% | 5.4 to 3.8 | |
| 22 | Tennessee | 16,005 | 14,784 | 10,818 | -3,966 | -7.6% | 5.4 to 3.8 | |
| 23 | Arkansas | 5,855 | 6,314 | 4,801 | -1,513 | +7.8% | 6.0 to 4.3 | |
| 24 | Louisiana | 4,245 | 5,290 | 4,054 | -1,236 | +24.6% | 3.4 to 2.5 | |
| 25 | Mississippi | 5,110 | 8,373 | 6,459 | -1,914 | +63.9% | 9.1 to 6.9 | |
| 26 | West Virginia | 3,743 | 3,169 | 2,449 | -720 | -15.3% | 5.9 to 4.4 | |
| 27 | Florida | 61,609 | 52,250 | 40,677 | -11,573 | -15.2% | 6.3 to 4.6 | |
| 28 | Kentucky | 10,018 | 8,990 | 7,048 | -1,942 | -10.3% | 5.5 to 4.2 | |
| 29 | North Carolina | 13,072 | 13,399 | 10,570 | -2,829 | +2.5% | 3.3 to 2.5 | |
| 30 | Texas | 59,227 | 67,803 | 53,741 | -14,062 | +14.5% | 6.0 to 4.5 | |
| 31 | Missouri | 11,083 | 9,819 | 7,836 | -1,983 | -11.4% | 4.0 to 3.2 | |
| 32 | New York | 9,383 | 8,375 | 6,817 | -1,558 | -10.7% | 1.1 to 0.8 | |
| 33 | Oklahoma | 9,130 | 10,390 | 8,629 | -1,761 | +13.8% | 8.0 to 6.3 | |
| 34 | Georgia | 11,223 | 15,620 | 13,504 | -2,116 | +39.2% | 3.8 to 3.2 | |
| 35 | Iowa | 4,066 | 3,774 | 3,274 | -500 | -7.2% | 2.9 to 2.5 | |
| 36 | New Jersey | 9,907 | 8,981 | 8,254 | -727 | -9.3% | 2.5 to 2.2 | |
| 37 | Washington | 4,909 | 4,172 | 4,148 | -24 | -15.0% | 1.4 to 1.4 | |
| n/a | Puerto Rico | 3,110 | 3,247 | 3,453 | +206 | +4.4% | 4.4 to 4.6 |
Arizona, Texas and Georgia include the five counties that together lost 8,781 call-center jobs in January 2024 with no matching layoff notice and no known cause; the figures keep that drop.
Puerto Rico is shown for reference and is not ranked.
Call-Center Jobs by County: 38 Counties Ranked
This table ranks every county with at least 2,000 call-center jobs in 2022 that BLS shows in both 2022 and 2025. Of the 38, 37 had fewer call-center jobs in 2025 than in 2022. Two more counties passed 2,000 in 2022 but are hidden by BLS in 2025: Hamilton County, Tennessee (Chattanooga) and Cameron County, Texas (Brownsville).
| 1 | Bexar County, Texas | San Antonio-New Braunfels, TX | 9,098 | 9,512 | 3,984 | -5,528 | +4.6% | |
|---|---|---|---|---|---|---|---|---|
| 2 | Richland County, South Carolina | Columbia, SC | 2,565 | 2,225 | 934 | -1,291 | -13.3% | |
| 3 | Bernalillo County, New Mexico | Albuquerque, NM | 3,080 | 3,670 | 1,610 | -2,060 | +19.2% | |
| 4 | Franklin County, Ohio | Columbus, OH | 4,142 | 2,414 | 1,096 | -1,318 | -41.7% | |
| 5 | Washington County, Oregon | Portland-Vancouver-Hillsboro, OR-WA | 2,810 | 2,382 | 1,252 | -1,130 | -15.2% | |
| 6 | Wayne County, Michigan | Detroit-Warren-Dearborn, MI | 3,665 | 2,181 | 1,180 | -1,001 | -40.5% | |
| 7 | Dallas County, Texas | Dallas-Fort Worth-Arlington, TX | 7,862 | 8,563 | 4,865 | -3,698 | +8.9% | |
| 8 | Pima County, Arizona | Tucson, AZ | 8,780 | 5,359 | 3,310 | -2,049 | -39.0% | |
| 9 | Ada County, Idaho | Boise City, ID | 3,864 | 3,377 | 2,098 | -1,279 | -12.6% | |
| 10 | Maricopa County, Arizona | Phoenix-Mesa-Chandler, AZ | 19,842 | 14,749 | 9,224 | -5,525 | -25.7% | |
| 11 | Los Angeles County, California | Los Angeles-Long Beach-Anaheim, CA | 3,662 | 2,643 | 1,665 | -978 | -27.8% | |
| 12 | Pinellas County, Florida | Tampa-St. Petersburg-Clearwater, FL | 4,504 | 2,711 | 1,736 | -975 | -39.8% | |
| 13 | Cook County, Illinois | Chicago-Naperville-Elgin, IL-IN | 3,293 | 2,978 | 1,931 | -1,047 | -9.6% | |
| 14 | Greenville County, South Carolina | Greenville-Anderson-Greer, SC | 2,462 | 2,399 | 1,581 | -818 | -2.6% | |
| 15 | Wake County, North Carolina | Raleigh-Cary, NC | 2,198 | 2,555 | 1,695 | -860 | +16.2% | |
| 16 | Salt Lake County, Utah | Salt Lake City-Murray, UT | 7,729 | 5,209 | 3,490 | -1,719 | -32.6% | |
| 17 | Duval County, Florida | Jacksonville, FL | 2,204 | 2,443 | 1,672 | -771 | +10.8% | |
| 18 | Clark County, Nevada | Las Vegas-Henderson-North Las Vegas, NV | 14,915 | 14,681 | 10,202 | -4,479 | -1.6% | |
| 19 | Madison County, Alabama | Huntsville, AL | 2,328 | 2,208 | 1,543 | -665 | -5.2% | |
| 20 | Tulsa County, Oklahoma | Tulsa, OK | 4,242 | 2,548 | 1,790 | -758 | -39.9% | |
| 21 | Miami-Dade County, Florida | Miami-Fort Lauderdale-West Palm Beach, FL | 3,149 | 2,555 | 1,847 | -708 | -18.9% | |
| 22 | Hillsborough County, Florida | Tampa-St. Petersburg-Clearwater, FL | 7,095 | 5,618 | 4,116 | -1,502 | -20.8% | |
| 23 | Greene County, Missouri | Springfield, MO | 2,995 | 2,335 | 1,784 | -551 | -22.0% | |
| 24 | Tarrant County, Texas | Dallas-Fort Worth-Arlington, TX | 5,678 | 5,262 | 4,029 | -1,233 | -7.3% | |
| 25 | St. Louis County, Missouri | St. Louis, MO-IL | 3,530 | 2,325 | 1,812 | -513 | -34.1% | |
| 26 | Seminole County, Florida | Orlando-Kissimmee-Sanford, FL | 3,182 | 2,938 | 2,308 | -630 | -7.7% | |
| 27 | Brevard County, Florida | Palm Bay-Melbourne-Titusville, FL | 2,336 | 2,348 | 1,850 | -498 | +0.5% | |
| 28 | Davidson County, Tennessee | Nashville-Davidson-Murfreesboro-Franklin, TN | 2,906 | 2,459 | 1,951 | -508 | -15.4% | |
| 29 | Broward County, Florida | Miami-Fort Lauderdale-West Palm Beach, FL | 10,069 | 7,349 | 5,904 | -1,445 | -27.0% | |
| 30 | Travis County, Texas | Austin-Round Rock-San Marcos, TX | 2,225 | 2,254 | 1,865 | -389 | +1.3% | |
| 31 | Hidalgo County, Texas | McAllen-Edinburg-Mission, TX | 2,174 | 4,671 | 3,886 | -785 | +114.9% | |
| 32 | Johnson County, Kansas | Kansas City, MO-KS | 2,159 | 2,430 | 2,031 | -399 | +12.6% | |
| 33 | Harris County, Texas | Houston-Pasadena-The Woodlands, TX | 4,119 | 3,593 | 3,078 | -515 | -12.8% | |
| 34 | Oklahoma County, Oklahoma | Oklahoma City, OK | 3,121 | 4,534 | 3,954 | -580 | +45.3% | |
| 35 | Orange County, Florida | Orlando-Kissimmee-Sanford, FL | 8,866 | 6,304 | 5,779 | -525 | -28.9% | |
| 36 | El Paso County, Texas | El Paso, TX | 7,553 | 7,777 | 7,419 | -358 | +3.0% | |
| 37 | Palm Beach County, Florida | Miami-Fort Lauderdale-West Palm Beach, FL | 2,300 | 2,907 | 2,785 | -122 | +26.4% | |
| 38 | Orange County, California | Los Angeles-Long Beach-Anaheim, CA | 2,564 | 2,235 | 2,264 | +29 | -12.8% |
Bexar, Dallas, Harris and Maricopa counties are four of the five counties that together lost 8,781 call-center jobs in January 2024 with no matching layoff notice and no known cause; the figures keep that drop.
Methodology
- Source
- US Bureau of Labor Statistics, Quarterly Census of Employment and Wages (QCEW), open-data files downloaded on October 13 and 14, 2026. BLS revises QCEW each quarter.
- Industry
- NAICS 56142, telephone call centers, private employers only.
- Periods
- Places compare annual average call-center jobs in 2022 with 2025, and 2019 with 2022 for the change before ChatGPT. The national figure from launch compares November 2022 with November 2025.
- Places
- Counties, states and metro hubs with at least 2,000 call-center jobs in 2022, and 5,000 for the 13 biggest hubs. Metro hubs are 2023 federal metro areas, built by adding up their counties.
- Ranking
- Percentage change in call-center jobs from 2022 to 2025, steepest fall first.
- Per 1,000 private jobs
- Call-center jobs per 1,000 private jobs in the same area and year. The loss per 1,000 divides the 2022 to 2025 fall by all private jobs in the area in 2022.