Updated on March 24, 2026
100+ Job-Search Statistics You Have to Know in 2026
The latest job search statistics reveal everything about the hiring process and finding a job. See what the numbers mean for your search!


Novorésumé got people hired at
The job market has shifted. Applications are flooding in faster than ever, hiring timelines are stretching longer, and AI is changing how both sides of the process operate.
If you're currently looking for work, the numbers tell a clear story. Competition is steep, the tools are changing, and knowing where you stand can give you a real advantage.
That's why we've compiled 135 of the most up-to-date job search statistics for 2026, covering everything from how people find jobs to what makes hiring managers say yes.
Getting started on your resume? Use our professional resume builder to create it in minutes!
Choose a resume template to get started.
12 Key Job Search Statistics
Before getting into specifics, here are the headline numbers that define job search in 2026. These stats capture the current state of the market and the challenges job seekers face.
- The average job opening now receives 242 applications, up roughly 3 times from 2021 levels.
- A 2025 study found the average job seeker applies to 32 jobs and gets four interviews before being hired.
- The median time from application to first offer is 68.5 days, a 22% increase from early 2025.
- 71% of job seekers in 2025 said their current search was more difficult than their last – a survey-series high.
- Only 2%- 3% of submitted resumes result in an interview.
- 34% of job seekers reported searches lasting at least 6 months in mid-2025, a 16% increase from early that year.
- 74% of U.S. job seekers now use Artificial Intelligence in their application process.
- 59% of job seekers between jobs cited too much competition as a major pain point.
- 72% of U.S. job seekers reported that the job search process negatively affected their mental health.
- 55% of job candidates do not negotiate their starting salary, even though 73% consider salary the most important factor.
- Job openings fell to 6.5 million in December 2025, the lowest since December 2017, outside the pandemic.
- The broader U-6 underemployment rate (defined by the Bureau of Labor Statistics as the percentage of the labor force that is unemployed, plus marginally attached workers – those who gave up looking – and those employed part-time) was 8.4% in December 2025.
11 Job Search Methods & Channels Statistics
How people find jobs has also changed. Job boards still dominate application volume, but referrals, social media, and direct outreach each play a different role in the job hunt. Knowing which channels produce results and which just produce volume matters.
- 60% of all job applications originate from job boards like LinkedIn and Glassdoor.
- Less than 1% of candidates who apply through job boards and career sites are offered a position.
- 60% of job seekers use online job boards, 56% use professional networks, and 50% find opportunities through word of mouth.
- 81% of job seekers use social media in their job search.
- 71.3% of job seekers used referrals, 55% used professional networking sites, and 49.5% relied on company career pages as primary channels.
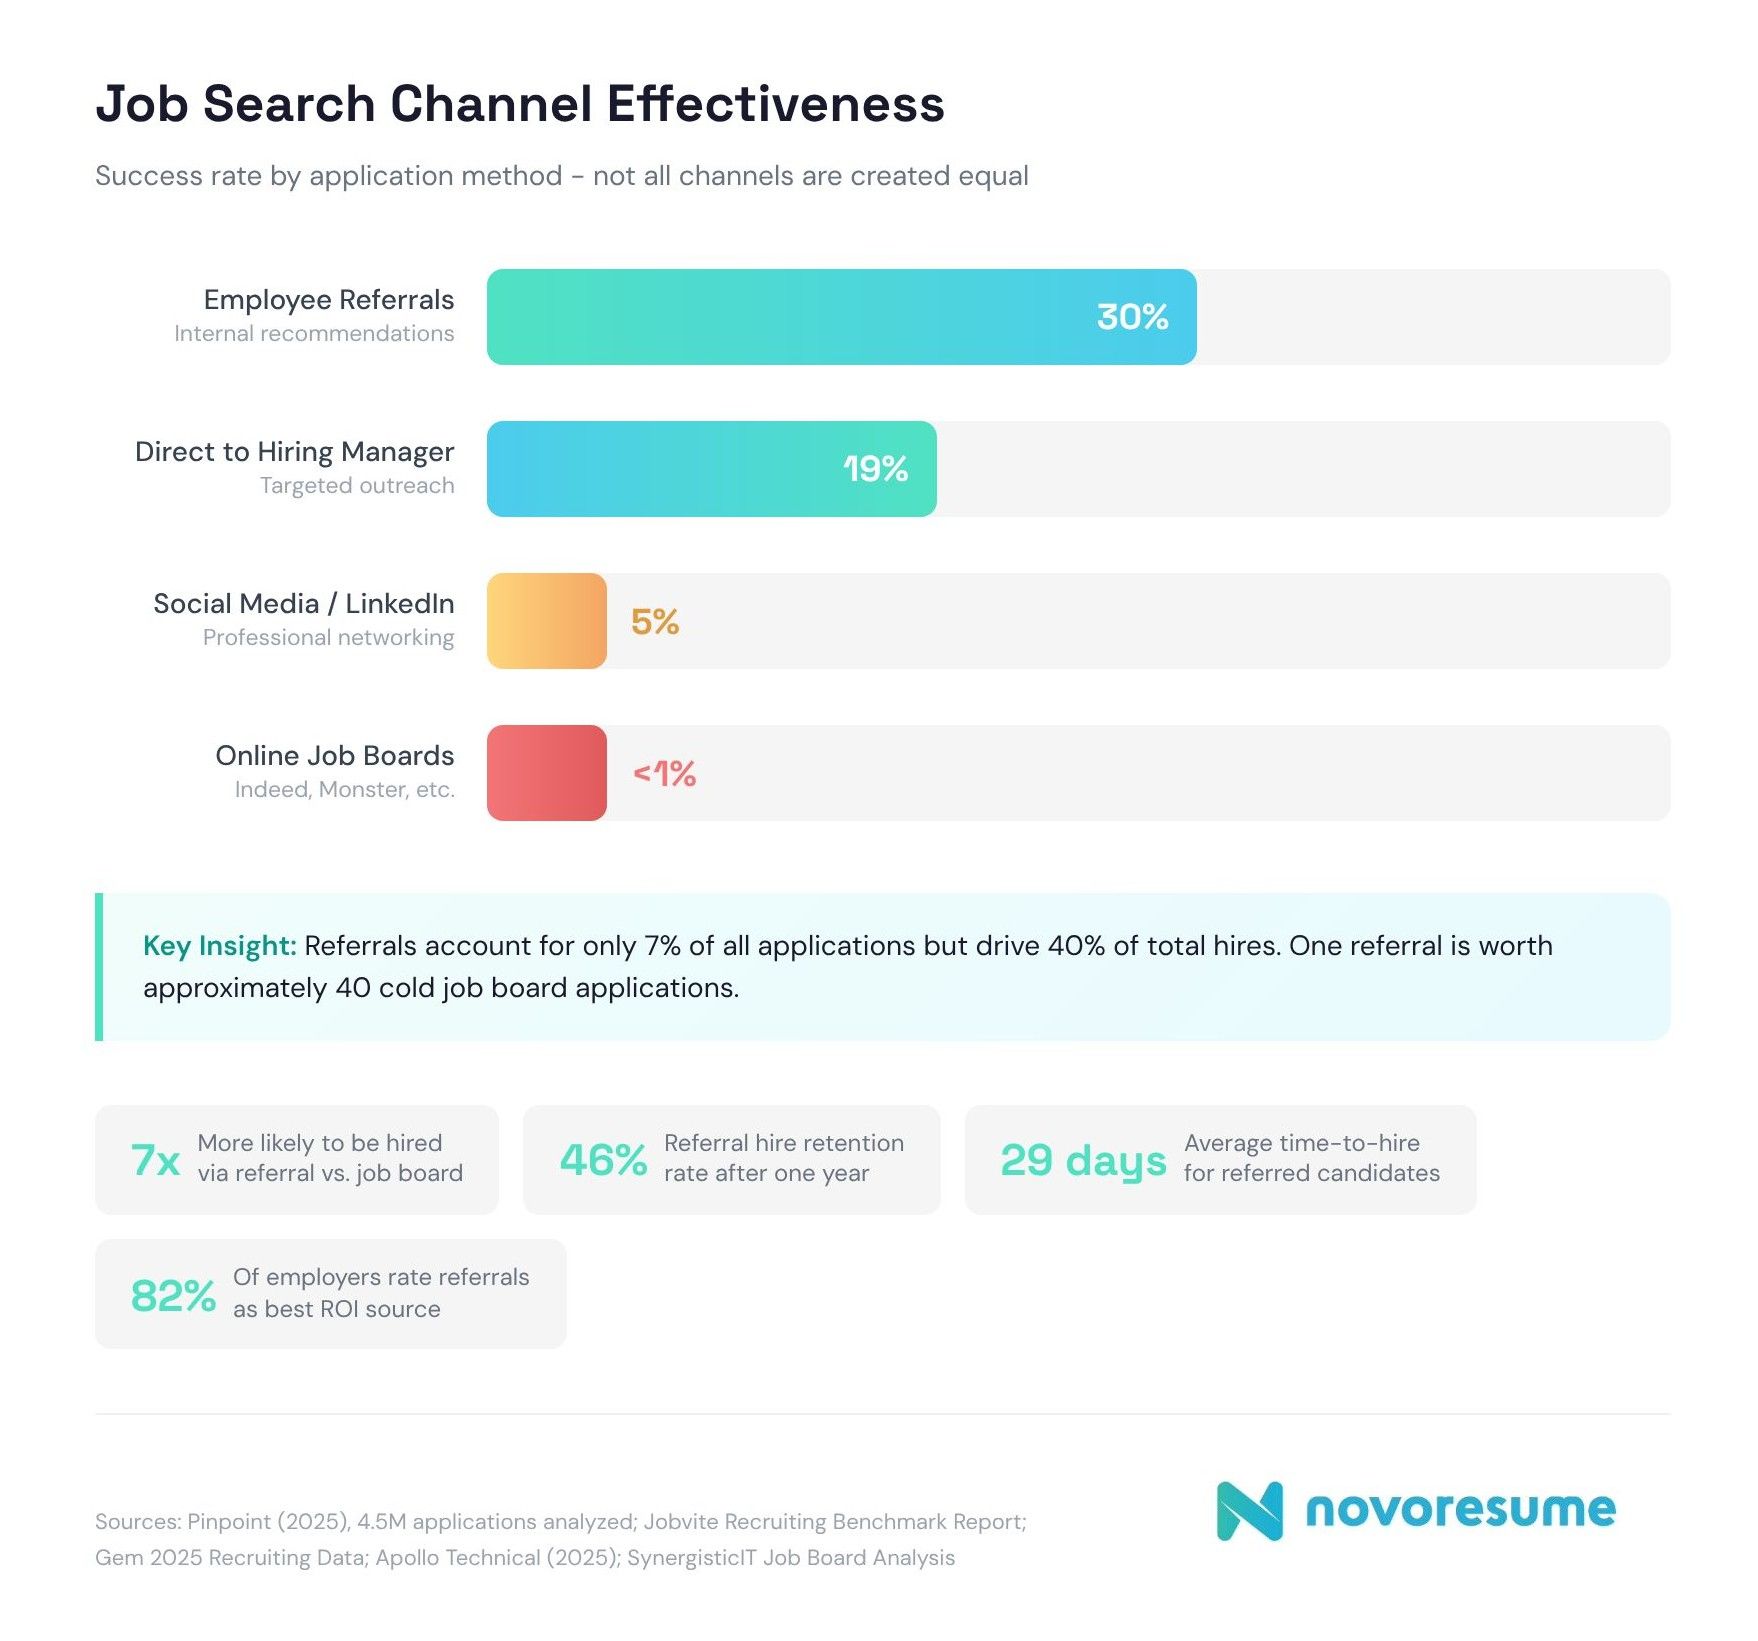
- The most effective way to apply is through the hiring manager: 19% of candidates who do so land the job, yet only 0.14% use this approach.
- 44% of Baby Boomers rely on word of mouth and personal networks for job searching, compared to 28% of Gen Z.
- 1 in 5 Gen Z applicants landed an interview via TikTok.
- 73% of job seekers aged 18-34 found their most recent job through social media.
- An estimated 75% of current positions are filled through the "hidden job market", vacancies that are not formally advertised.
- 68.6% of employers conduct "all" or "most" of their hiring through online job boards.
13 Application Volume & Competition Statistics
Getting a response from an employer is harder than it has been in years. Application volumes have surged thanks to AI tools and a tight market, making it more difficult for any one resume to stand out.
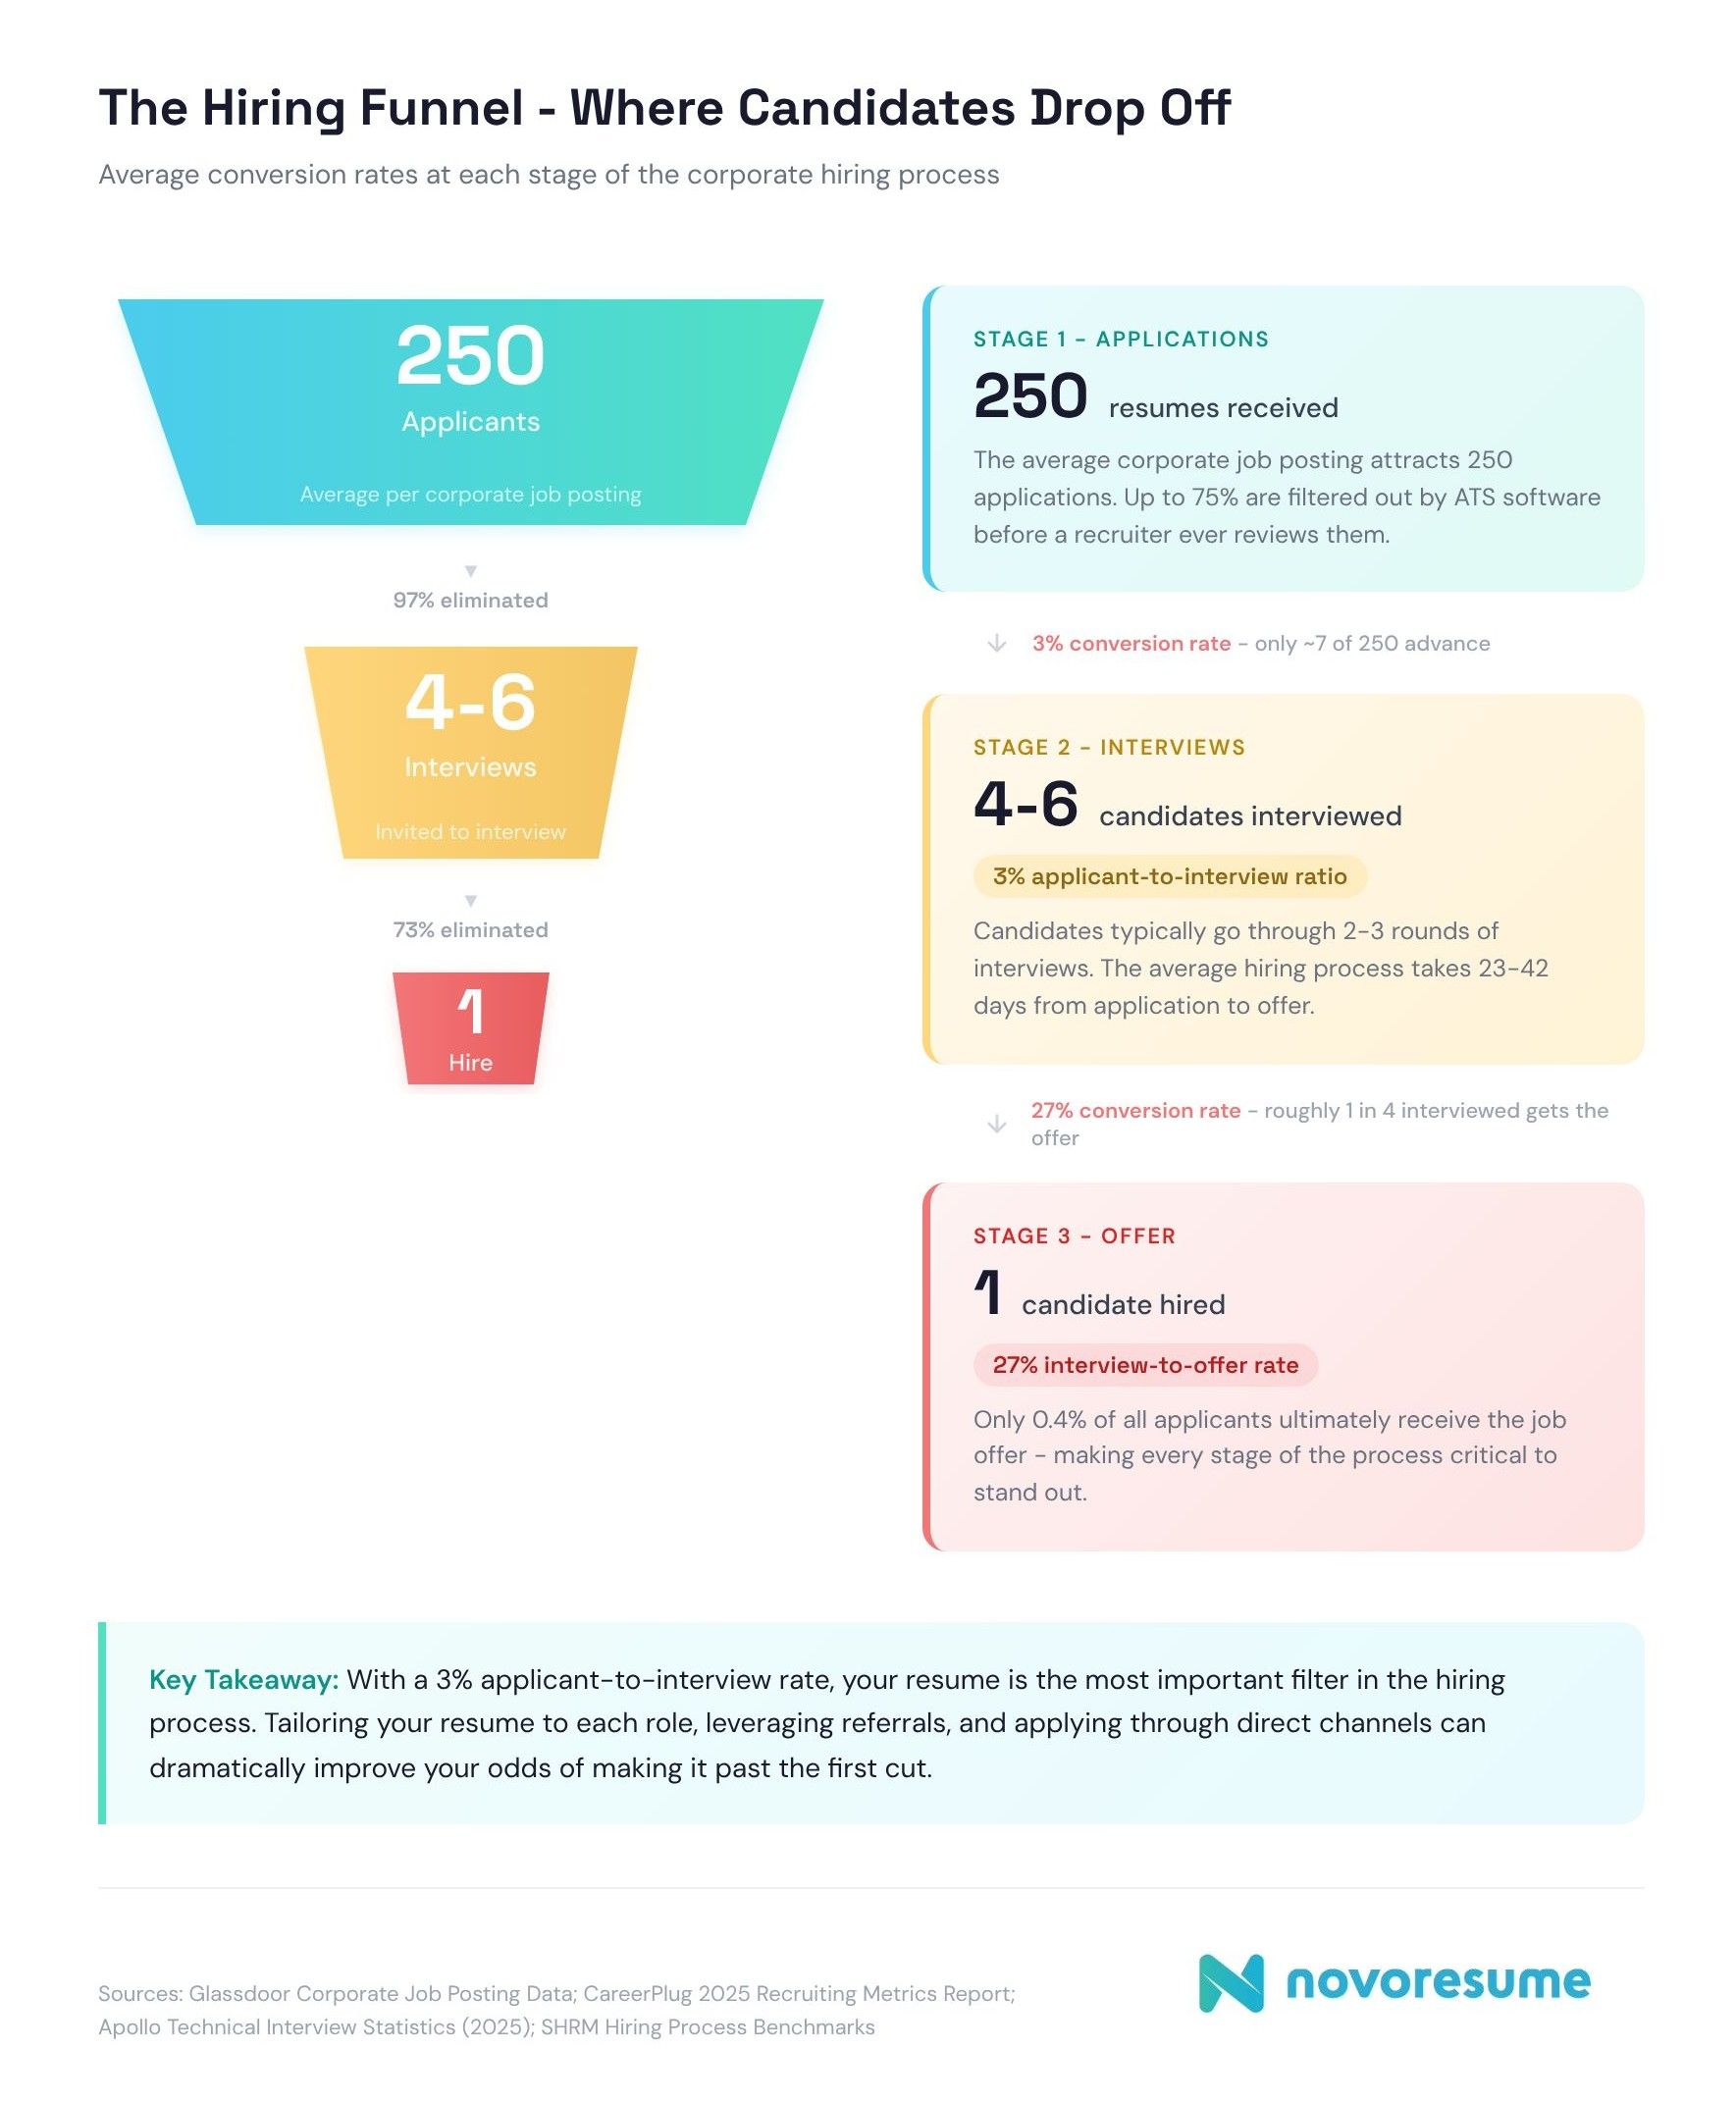
- The average corporate job posting attracts approximately 250 resumes.
- Entry-level and customer service roles average 400-600 applicants, while remote tech and support jobs often exceed 1,000 in the first week.
- Software engineering roles can hit 2,000+ applications before screening begins.
- The applicant-to-interview ratio in 2024 was 3%, meaning just 3 out of 100 applicants were invited to interview.
- That rate has dropped steadily from 15.25% in 2016 and 8.4% in 2023, a 34% decrease in just one year.
- Between 2021 and 2024, weekly application rates increased roughly threefold across business and tech roles.
- A prospective applicant is 3x less likely to hear back for a role today than four years ago.
- Most online applications result in a 0.1%-2% success rate from application to offer.
- The busiest 10% of candidates sent 19 applications per week.
- New hires received an average of 3.5 job offers during their search, and only 41% found their job within 1 month.
- Job seekers using AI complete 41% more applications than those who don't.
- In 2024, employers received an average of 180 applicants per hire, with automotive averaging around 234 and education and childcare averaging around 57.
- 59.7% of employers report receiving too many unqualified candidates when recruiting through job boards.
14 Resume Statistics
Your resume is often the first and only impression you make. With recruiters spending seconds on each one and most large companies filtering through applicant tracking systems, how you present your experience has a measurable impact on your odds.
Recruiter Review Time
- Recruiters spend an average of 7.4 seconds on an initial resume screen, up from 6 seconds in 2012.
- 60% of employers view a resume for 11 seconds or less before deciding, and only 14% spend more than one minute on it.
- 72% of recruiters spend less than two minutes reviewing a resume before making a decision.
- Eye-tracking studies show recruiters focus roughly 80% of their review time on name and current title, current company and dates, previous company and dates, and education.
ATS and Screening
- 98% of large organizations (Fortune 500) use an applicant tracking system to filter resumes, making an ATS-friendly resume a necessity.
- 92% of recruiters confirmed that their ATS does not automatically reject resumes based on formatting, design, or content; however, 100% use knockout questions for compliance filtering, such as work authorization and required licenses.
- 44% of ATS systems offer AI "fit scores," but 56% of recruiters either disable the feature or disregard it.
- A resume scoring 80% or more on keyword matching is the general standard for being forwarded to a human recruiter.
Tailoring and Impact
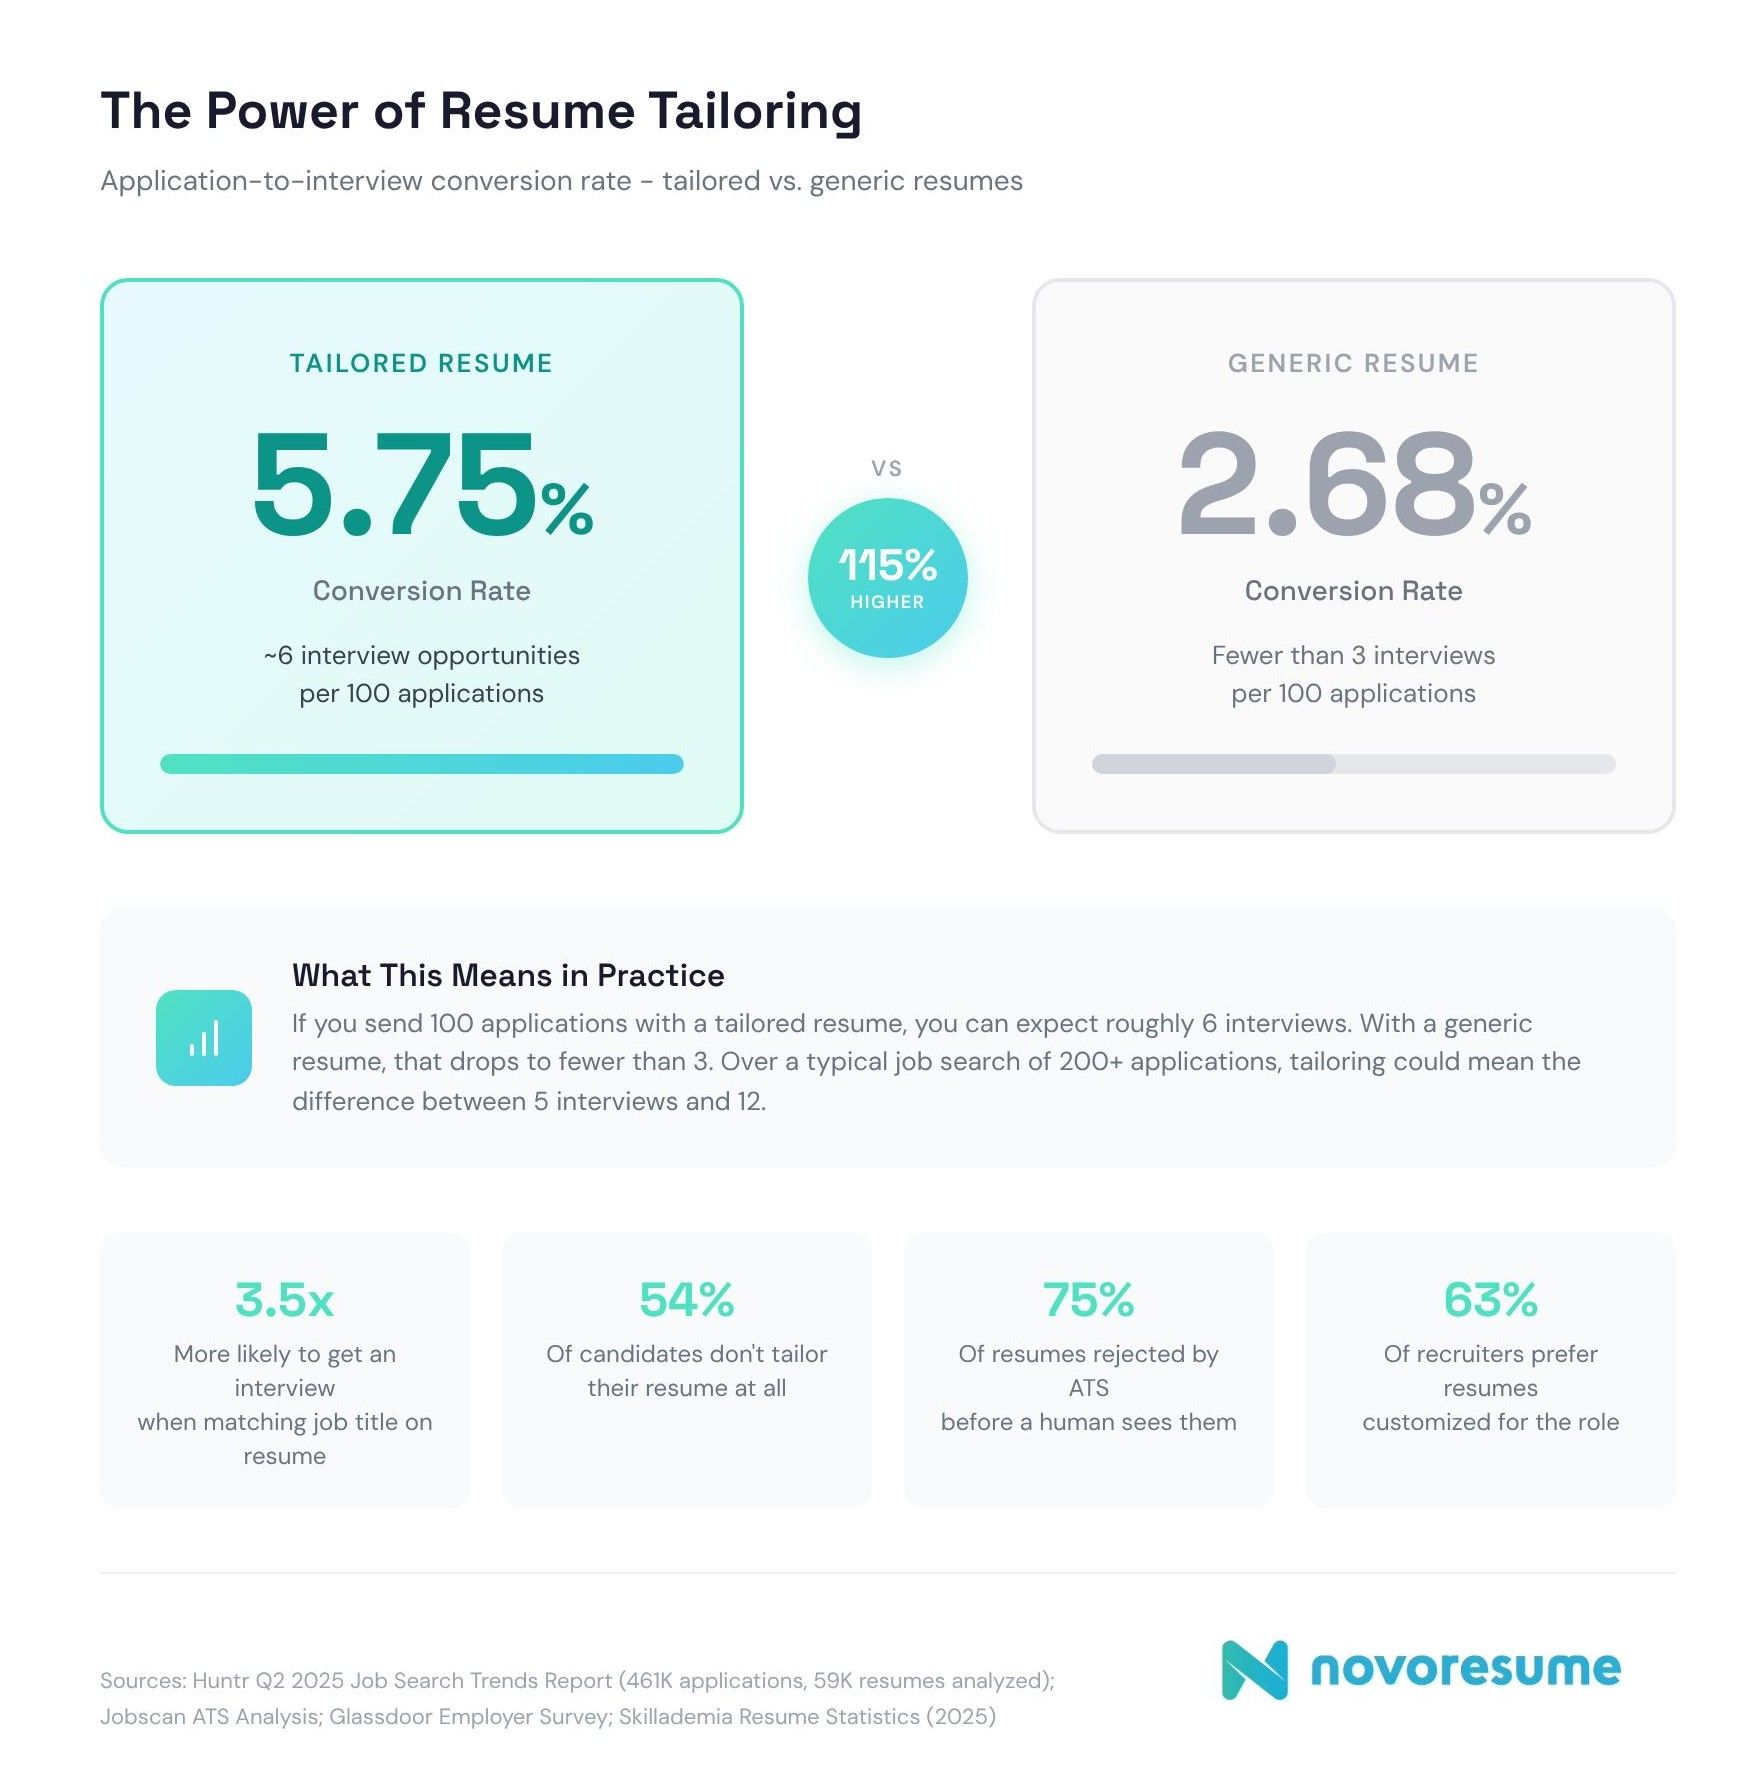
- Tailored resumes achieved a 5.75% conversion rate from application to interview, compared to 2.68% for generic resumes, a 115% improvement.
- 54% of candidates don't tailor their resume to the job description.
- Candidates who tailor their application get a 78% higher response rate than those who send the same resume to every job.
- Including a link to a comprehensive LinkedIn profile increases the callback rate by 71%.
- Including quantified achievements increases interview chances by roughly 40%.
- Candidates' resumes contain only 51% of the job description's keywords on average, covering 60% of hard skills but only 28% of soft skills.
12 Interview Statistics
Interviews are where applications turn into offers or dead ends, which is why you should always prepare for a job interview in advance. The process has become longer and more complex, with companies adding more rounds and taking more time to decide. Here's how the interview stage looks in 2026.
Interview Rounds and Odds
- Candidates typically go through 2 to 5 rounds of interviews before receiving an offer, depending on the position level.
- Companies typically interview 6 to 10 candidates for any given position.
- Only 4-6 candidates out of roughly 250 applicants are called back for an interview.
- Candidates who completed one interview had a 36.89% chance of receiving an offer, while those with 3 interviews had a 51% chance.
- 30.89% of all interviewees received job offers.
- The interview-to-hire ratio in 2024 was 27%, just over 1 in 4.
- 17.3% of U.S. job offers, more than 1 in 6, are rejected by candidates.
Timing and Format
- The average interview process length in the U.S. in 2024 was around 23.8 days.
- Candidates wait nearly twice as long after interviews (11 days) as they do to get them (6 days).
- Hiring teams now conduct 42% more interviews per hire than in 2021, leading to a 24% increase in time-to-hire (41 days vs. 33 days).
- 81% of recruiters now use video interviews as part of their hiring process, yet 70% of U.S. job seekers prefer in-person interviews.
- 42% of candidates withdraw from the hiring process because scheduling took too long, and 47% drop out due to poor communication.
9 Job Search Duration Statistics
One of the hardest parts of any job search is not knowing how long it will take. The data shows that searches are getting longer, and a growing share of job seekers are spending six months or more looking for work.
- The average job search takes approximately 5 months (roughly 19.9 weeks as of April 2024), though the median is notably lower at 8.7 weeks.
- The median time to first offer increased 22% to 68.5 days in mid-2025.
- Average time-to-hire has grown to approximately 42 days in 2025, driven by additional interviews, assessments, and more deliberate hiring decisions.
- 34% of job seekers reported that their searches lasted at least 6 months in mid-2025, a 16% increase from early 2025 and 12% from mid-2024.
- The share of people who have been job hunting for 6+ months has increased by more than 50% over the past two years.
- 1.6 million Americans had been looking for a new job for at least 6 months as of early 2025.
- Long-term unemployed (27+ weeks) totaled 1.8 million in January 2026, up by 386,000 from a year earlier, accounting for 25.0% of all unemployed.
- 35.5% of job searches last less than 5 weeks, 31.2% last 5-14 weeks, and 33.3% last 15 weeks or more.
- Tech fields saw notable declines in job availability in 2025: Data Science (-28.44%), Computer Engineering (-23.67%), Information Technology (-19.82%), and Computer Science (-18.81%).
12 Networking & Referral Statistics
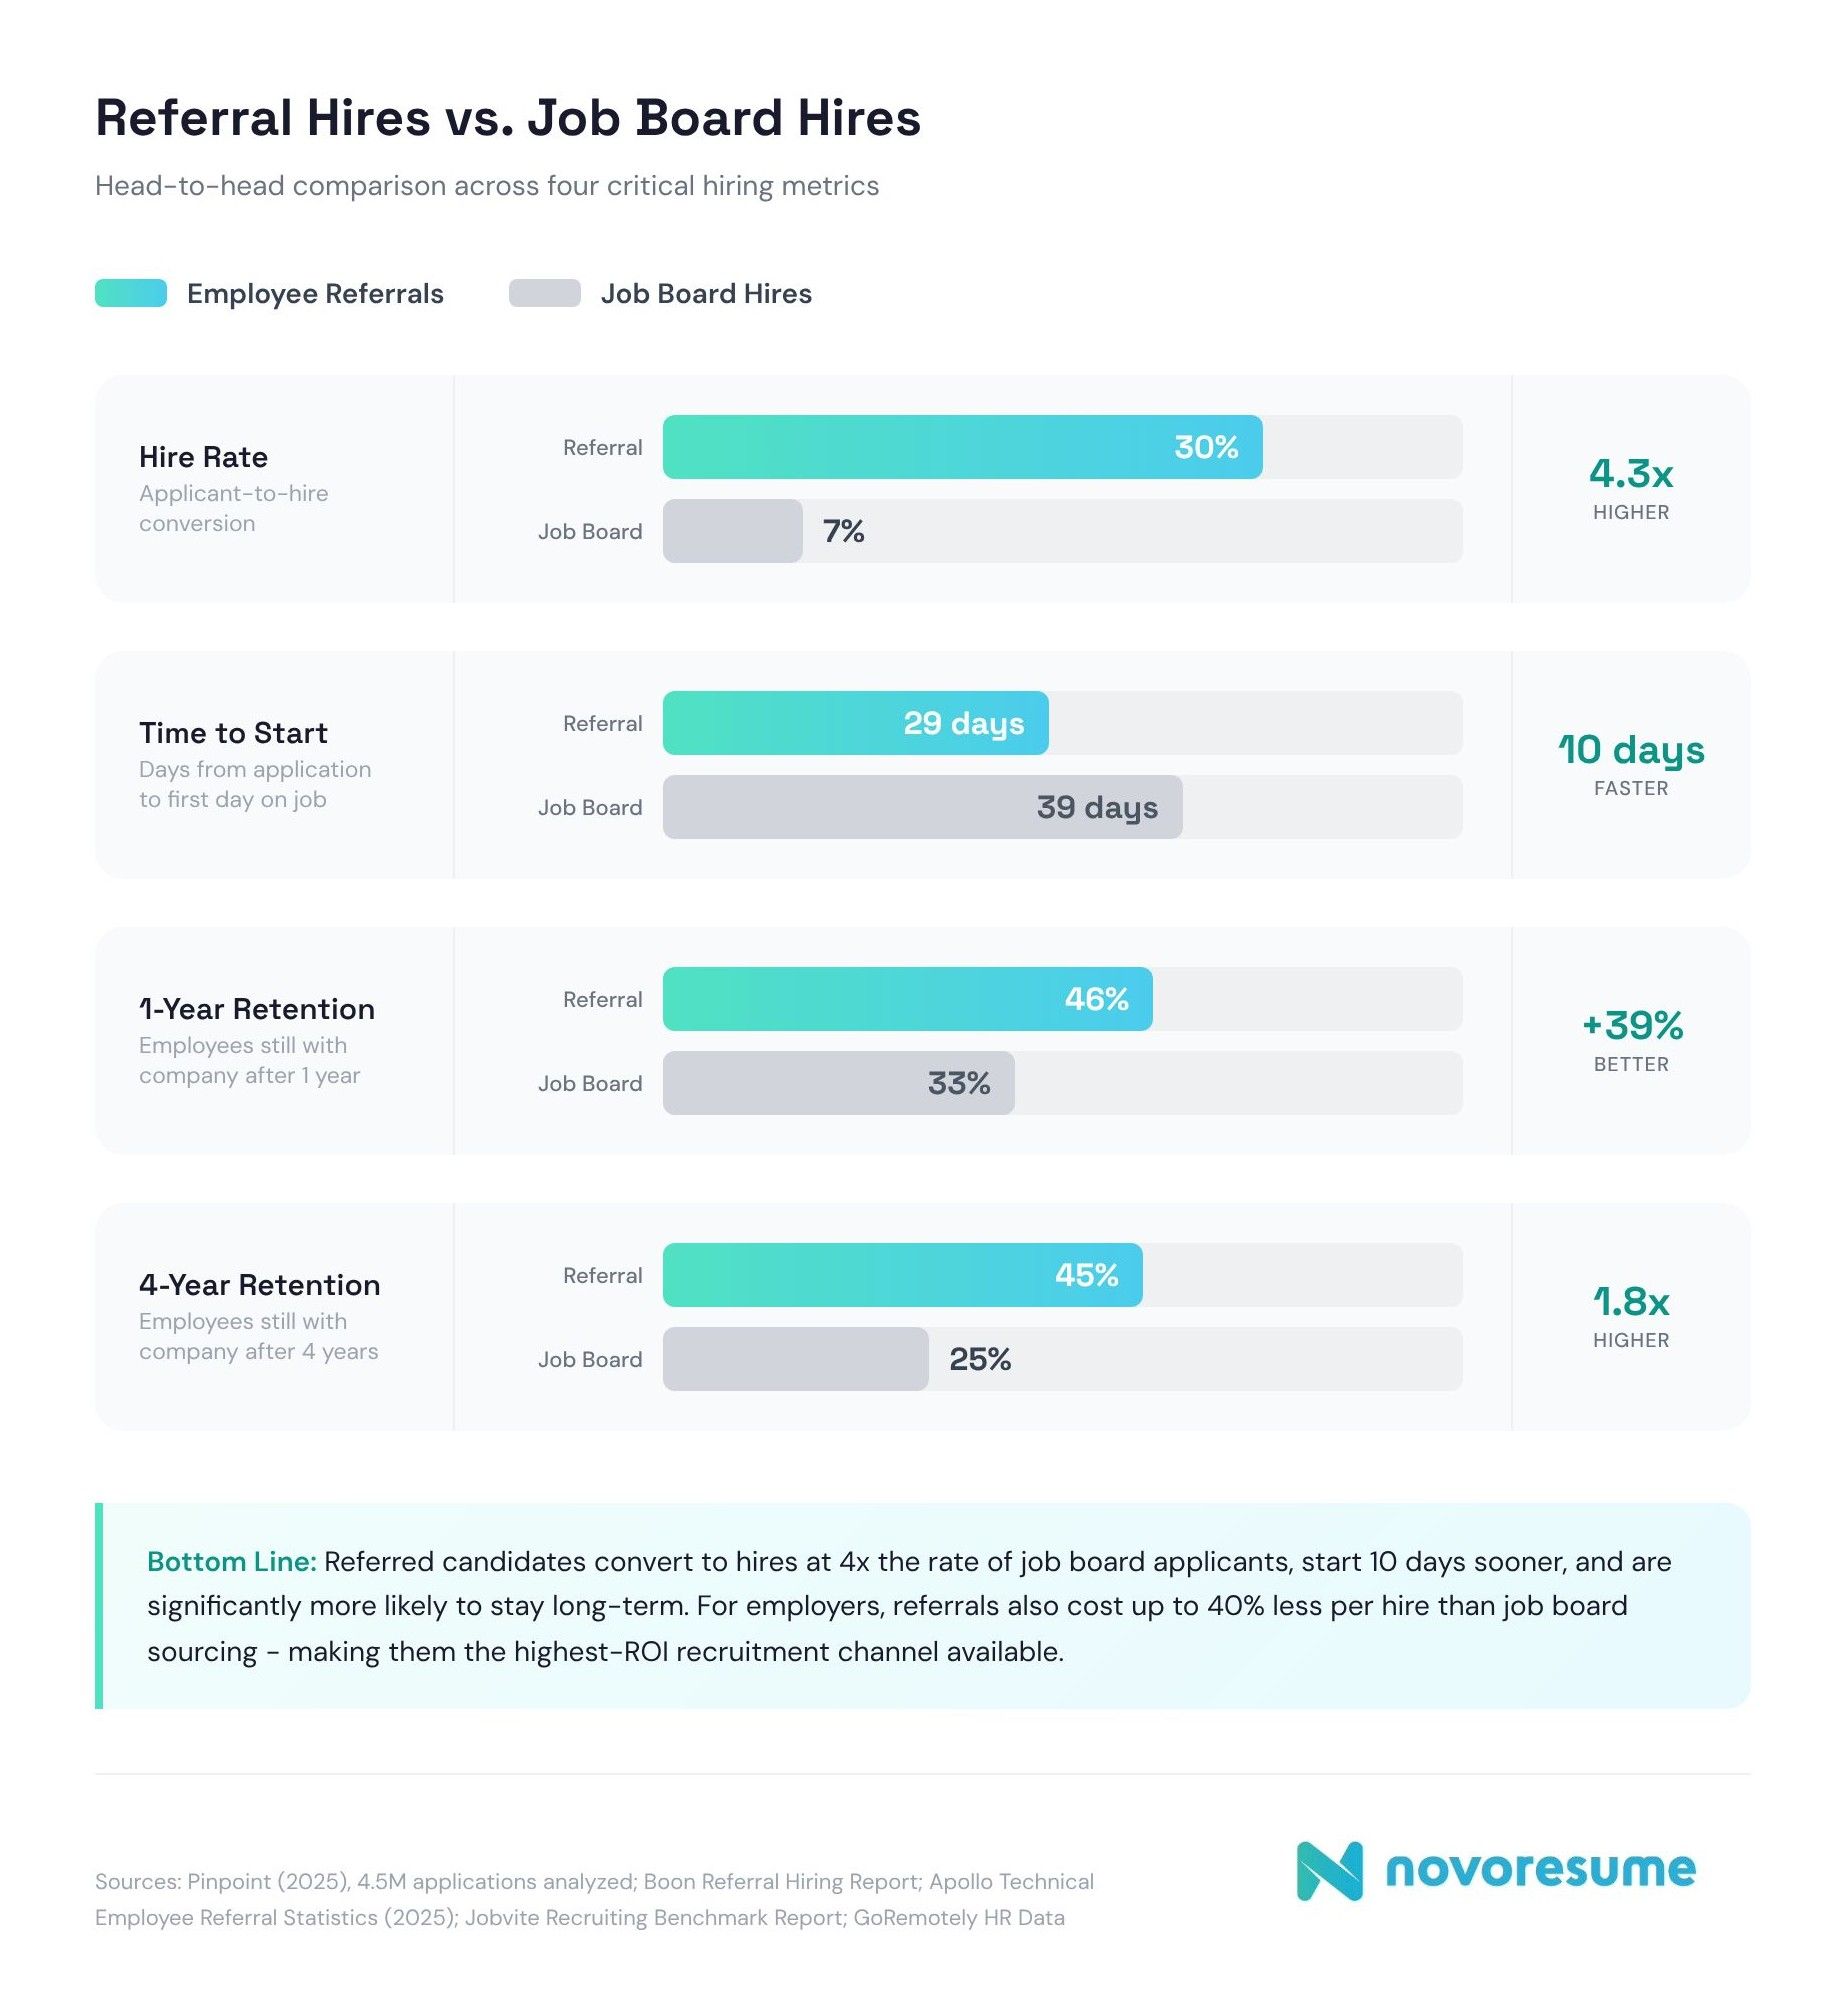
Applying online is the default, but referrals tip the odds in your favor. Referred candidates get hired faster, stay longer, and perform better. Here's why your professional network might be your strongest job search tool.
- Employee referrals account for 30-50% of all new hires in the U.S.
- Only 7% of applicants come through referrals, yet referrals make up 40% of all hires.
- Referred candidates are hired at a 30% rate, compared to an average of 7% for candidates sourced through other methods, a 4.3x advantage.
- 82% of employers rated employee referrals as generating the best Return On Investment (ROI) above all other sources.
- 84% of companies worldwide now run employee referral programs.
- Referred candidates are 55% faster to hire compared with employees sourced through career sites.
- Employee referrals take 29 days to start, compared to 55 days for career site hires and 39 days for job board hires.
- Referral programs save organizations $3,000+ per hire.
- Referral hires have a 46% retention rate after one year, compared to 33% for job board hires.
- 45% of employees referred by colleagues stay for more than 4 years, compared with only 25% sourced through job boards.
- Referral hires generate 25% more profit for companies than non-referral hires.
- Referral hires show a 33% increase in job performance compared to non-referral hires.
10 Online Job Boards & Platforms Statistics
Job boards remain the most common starting point for any job search. But not all platforms are created equal, and the numbers reveal a wide gap between where people apply and where they get results.
- Indeed has 32.34% market share in the job board category, followed by LinkedIn Jobs (25.61%) and Glassdoor Jobs (7.48%).
- Indeed reaches 96.7% of U.S. online job seekers and processes 27 hires per minute.
- Indeed receives over 350 million unique visitors monthly.
- LinkedIn hosts approximately 15.7 million active jobs globally.
- Indeed generates 66% of all applications, with a 99% offer acceptance rate, while LinkedIn produces 13% of total applications but achieves twice the interview rate.
- On LinkedIn, only 10% of U.S. job postings in December 2023 were for remote roles, yet those postings received 46% of all applications.
- 66% of recruiters use Indeed as their online job board, while 24% prefer LinkedIn and 6% prefer Glassdoor.
- Job boards are becoming less effective overall, with a 13% drop in candidate usage and a 300% increase in job board costs.
- Internal hiring is 6 times more effective than any other hiring source.
- Google Jobs delivered the highest response rate at 9.3%, nearly 3 times LinkedIn's 3.3%.
10 Social Media & Job Search Statistics
Social media has, in a way, become a second resume. Employers are screening your profiles and checking your personal branding, and what they find can make or break your chances before you even get to an interview.
- 70% of employers use social networking sites to research job candidates, up from 11% in 2006.
- 73% of hiring managers use social media to evaluate applicants, and 85% have rejected candidates because of something they found online.
- 31% of hiring managers "always" check candidates' social media, and 44% "sometimes" do, meaning 88% at least occasionally check.
- 57% of employers are less likely to call someone for an interview if they can't find the candidate online.
- 54% of companies have rejected a candidate based on their social media profiles.
- 44% of employers found social media content that led them to hire a candidate, with the top reasons being background information supporting qualifications (38%), strong communication skills (37%), and a professional image (36%).
- Candidates with a comprehensive LinkedIn profile are 71% more likely to get a job interview.
- Job seekers using the #OpenToWork feature receive 40% more InMails from recruiters.
- Profiles with multiple skill endorsements receive 17 times more recruiter views.
- A complete LinkedIn profile that complements your resume gets 21 times more profile views and 36x more messages.
11 Salary & Negotiation Statistics
Salary negotiation remains one of the most overlooked steps in the job search. Most employers expect it, most candidates skip it, and the data shows just how much money is left on the table.
- 55% of job candidates do not negotiate their starting salary, even though 73% consider salary the most important factor.
- 73% of employers expect candidates to negotiate salary on an initial job offer.
- 58% of Americans accepted their current position without negotiating.
- People who negotiated salary received an average increase of 18.83% from their original offers.
- 85% of Americans who counteroffered on salary received at least some of what they requested.
- 75% of employers said they could raise starting salary offers by 5-10% during negotiations.
- About 90% of employers are open to negotiating salary for either some or all positions.
- By generation, 55% of Gen Z negotiated salary, compared to 48% of Millennials, 42% of Gen X, and 42% of Baby Boomers.
- 57% of American workers expressed regret about how they handled their salary negotiation.
- Women who consistently negotiate their salaries earn over $1 million more across their lifetimes than women who do not.
- In 2024, women earned 85% of what men earned, representing a 15-cent pay gap among all workers. Among workers ages 25-34, the gender wage gap narrowed to just 5 cents.
10 Remote Work & Job Search Statistics
Remote and hybrid work remain top priorities for job seekers, but the supply of flexible roles has tightened. The gap between what candidates want and what employers are offering has real consequences for how the job search plays out.
- Remote work roles attract 60% of all job applications but represent only about 20% of job postings.
- Fully remote roles receive, on average, 2.6 times more applications than in-person jobs.
- In Q4 2025, 65% of new U.S. job postings were fully on-site, 24% were hybrid, and 11% were fully remote.
- 46% of workers with remote-capable jobs say they'd likely quit if forced back to on-site full-time work.
- 81% of workers say remote work is the most important factor in a job, ahead of salary (77%) and flexible scheduling (72%).
- 69% of workers say they would accept a pay cut to work remotely, up 11 percentage points from 2024.
- 83% of global CEOs anticipate a return to full-time office work by 2027.
- Remote hiring is more efficient, with an average time-to-hire of 32 days compared to 38 days for on-site roles, roughly 16% faster.
- Senior-level roles have the most flexibility, with around 45% including a remote component (31% hybrid, 14% fully remote).
- Entry-level roles offer the least flexibility, with only 18% hybrid and 10% remote postings.
11 Recruiter & Hiring Manager Perspectives
Understanding what's happening on the other side of the hiring process can help you tailor your approach. Recruiters are dealing with record application volumes, longer timelines, and shifting priorities around skills and screening.
- Average cost per hire is $4,700, up from $4,129 in 2019 – a 14% increase.
- Average time-to-fill is roughly 54 days. Technical roles average 88 days, while business roles average 68.
- 60% of companies reported an increase in their time-to-hire in 2024, up from 44% in 2023. Only 6% reduced their time-to-hire.
- 97% of employers value soft skills as much as or more than hard skills.
- 89% of recruiters say bad hires typically lack soft skills.
- 81% of U.S. employers now use skills-based hiring, up from 73% in 2023 and 57% in 2022.
- 77% of recruiters consider grammar mistakes a deal-breaker on resumes.
- 52% of U.S. job seekers reported being ghosted after an interview.
- 43% of U.S. candidates said a company changed the initially advertised salary after several interview rounds.
- 44% of job applicants admitted to lying during the hiring process; 24% on their resume, and 19% during the interview.
- 88% of talent acquisition professionals agree that quality of hire is the most useful recruiting metric, though most don't yet measure it systematically.
10 Job Market Overview Statistics
The broader labor market sets the stage for every individual job search. Whether you're entering the workforce, changing careers, or re-entering after a gap, these numbers offer a snapshot of the terrain.
- U.S. unemployment stood at 4.3% in January 2026, with 7.4 million people unemployed.
- December 2025 job openings fell to 6.5 million, the lowest since December 2017.
- The job openings-to-unemployed ratio dropped to approximately 0.87 in December 2025 – the first time job seekers outnumbered openings (outside the pandemic) since 2017.
- Payroll employment rose by roughly 181,000 in 2025, far less than the 2.0 million added in 2024.
- Federal government employment fell by 277,000 (9.2%) from its January 2025 peak through December 2025.
- Healthcare and social assistance are projected to be the largest U.S. job growth, with 5.2 million jobs expected from 2024 to 2034.
- Global unemployment rate hit 5.0% in 2024, the lowest since 1991, with around 186 million unemployed.
- Global youth unemployment was 12.6% in 2024, nearly 3x the adult rate of 4.3%.
- New graduates in 2025 face the most constrained entry-level market in 5 years: 33% of 2025 graduates and 20% of 2024 graduates are unemployed and seeking work.
- Class of 2025 graduates expect a starting salary of roughly $101,500, but the actual average is $68,700.
Conclusion
That wraps up our list of job search statistics and trends for 2026.
Whether you're actively applying, considering a career change, or just trying to understand the current market, we hope these numbers help you approach your job search with a clearer picture of what to expect and where to focus your efforts.
For more advice, check out the rest of our career blog!
Related posts

Job Interviews & Find A Job
Discover the best US cities for digital nomads in 2026, with Las Vegas ranking #1 for affordability, sunshine, airport access and remote-work essentials.

Job Interviews & Find A Job
Want an online job but don't know where to start? Check out our article for a list of the best online jobs, top job boards, and tips on how to apply!

Job Interviews & Find A Job
Get ready for your job hunt with these 19 reasons for leaving a job and a guide on how to talk about it during job interviews.