Call-Center Industry Jobs Since ChatGPT: 37 US Hubs and 37 States Ranked
US call-center industry jobs fell 24.1% from November 2022, when ChatGPT launched, to November 2025. See 37 hubs, 37 states and 38 counties ranked.


Novoresume got people hired at
























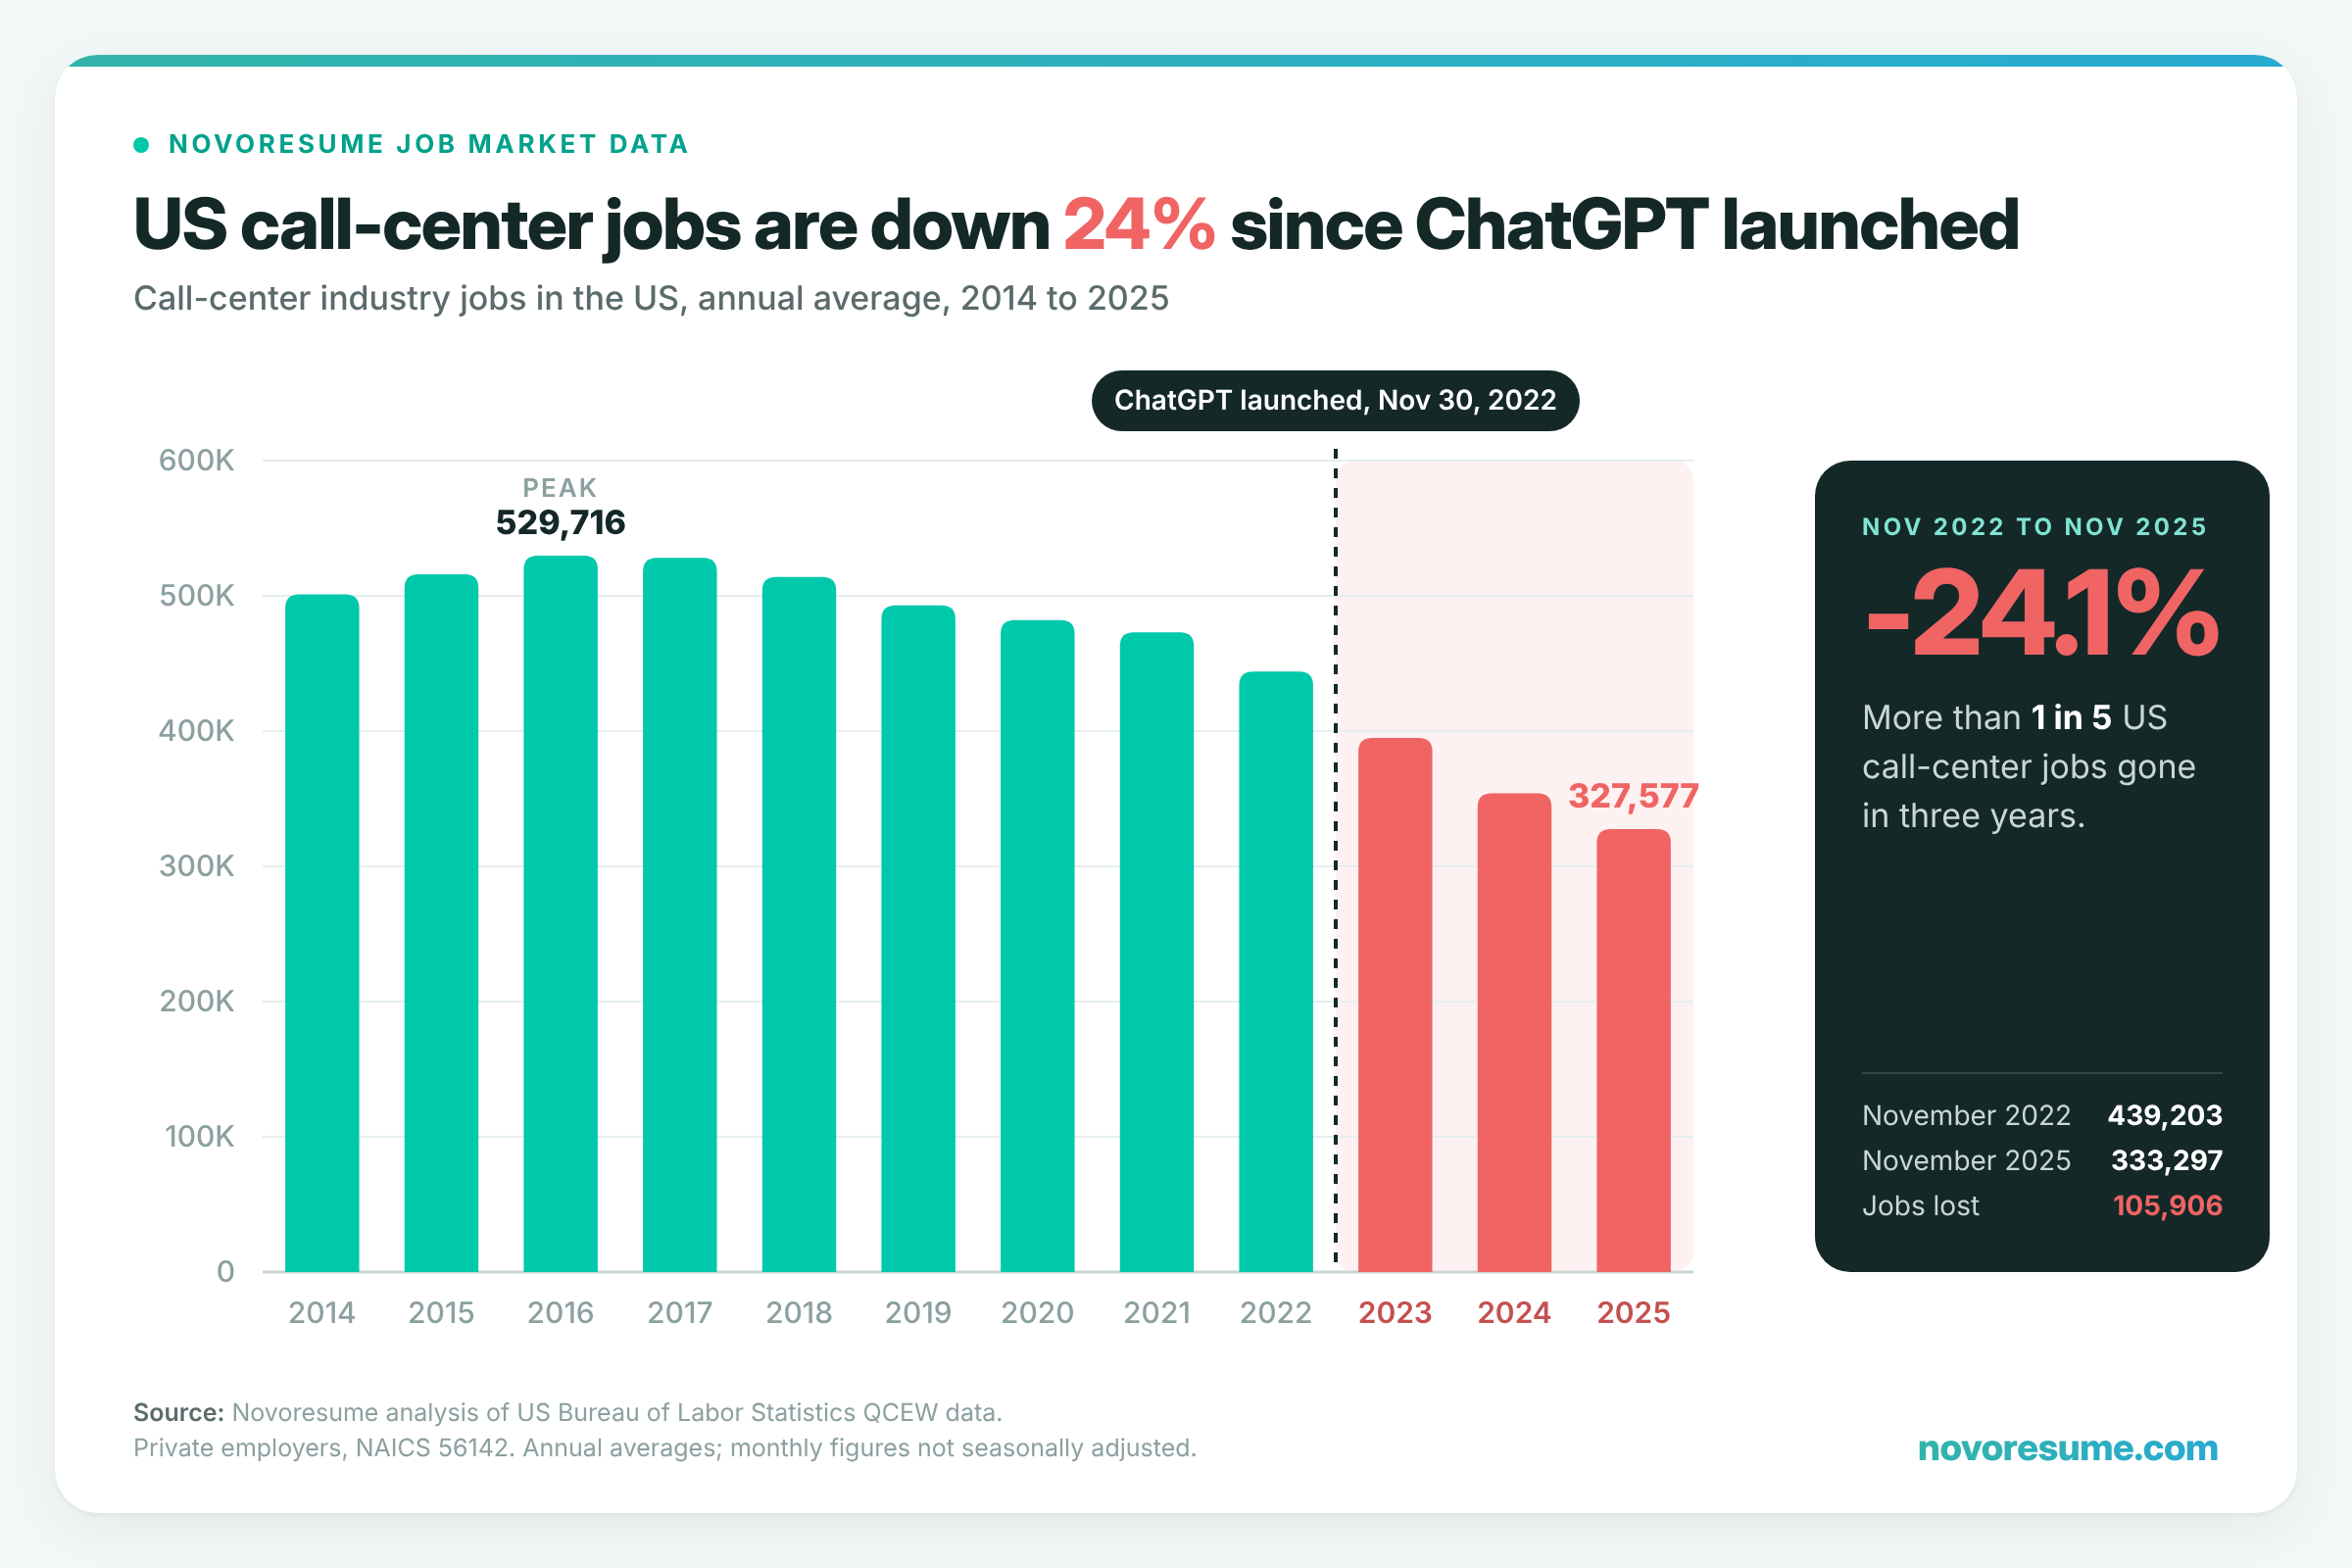
- Nearly 1 in 4 US call-center industry jobs have gone since ChatGPT launched. There were 439,203 in November 2022 and 333,297 in November 2025, a fall of 105,906 (24.1%). Private jobs outside the industry grew 2.6% over the same months.
- On annual averages, the US had 26% fewer call-center industry jobs in 2025 than in 2022: 443,316 down to 327,577, a fall of 115,739 (26.1%). All private jobs grew 3.5% over the same years.
- The decline started before ChatGPT. Call-center industry jobs peaked in 2016 (529,716) and have shrunk every year since 2017. The fall sped up during 2022, before ChatGPT launched, and was steepest in 2023 (down 11.0%).
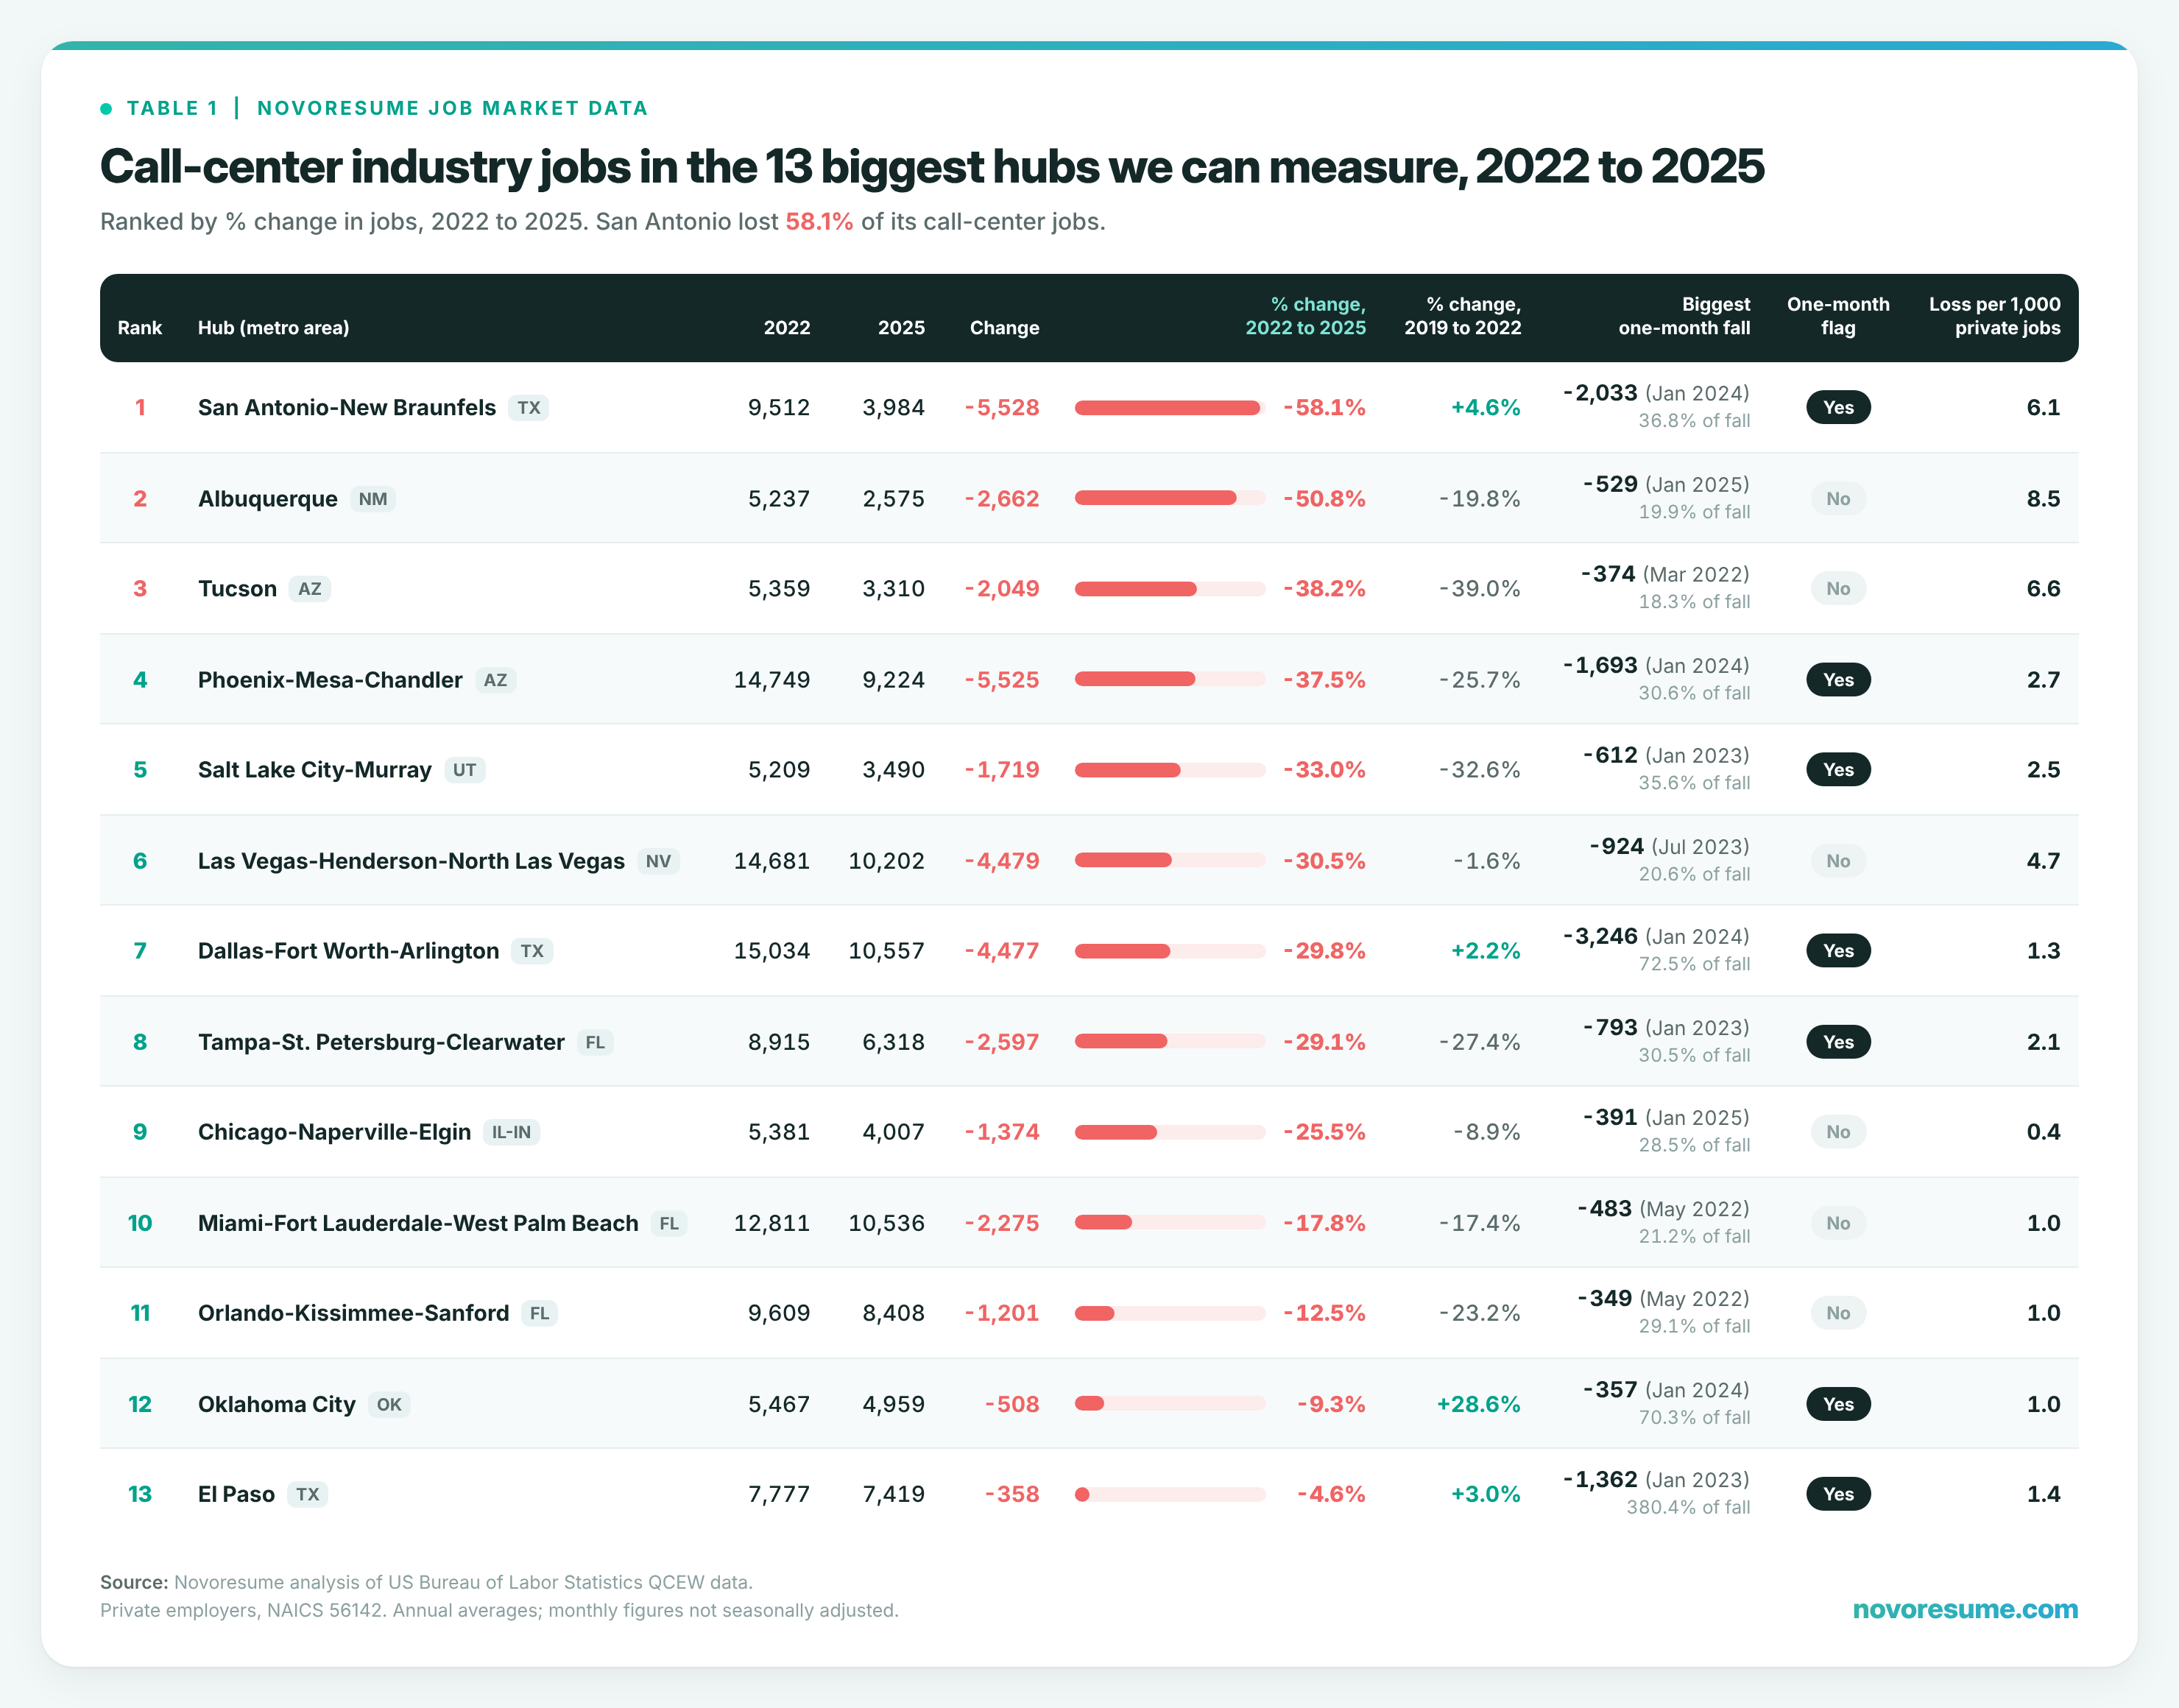
- All 13 of the biggest hubs we can measure (5,000+ call-center industry jobs in 2022) shrank by 2025. Three more big hubs, New York, Atlanta and Philadelphia, are partly hidden by BLS.
- Albuquerque lost about half its call-center industry jobs (5,237 in 2022, 2,575 in 2025, down 50.8%), the steepest fall among big hubs without a one-month cliff.
- Las Vegas was flat before 2022 and down 30.5% since. Its call-center industry jobs fell 1.6% from 2019 to 2022, then by 4,479 (14,681 to 10,202) from 2022 to 2025.
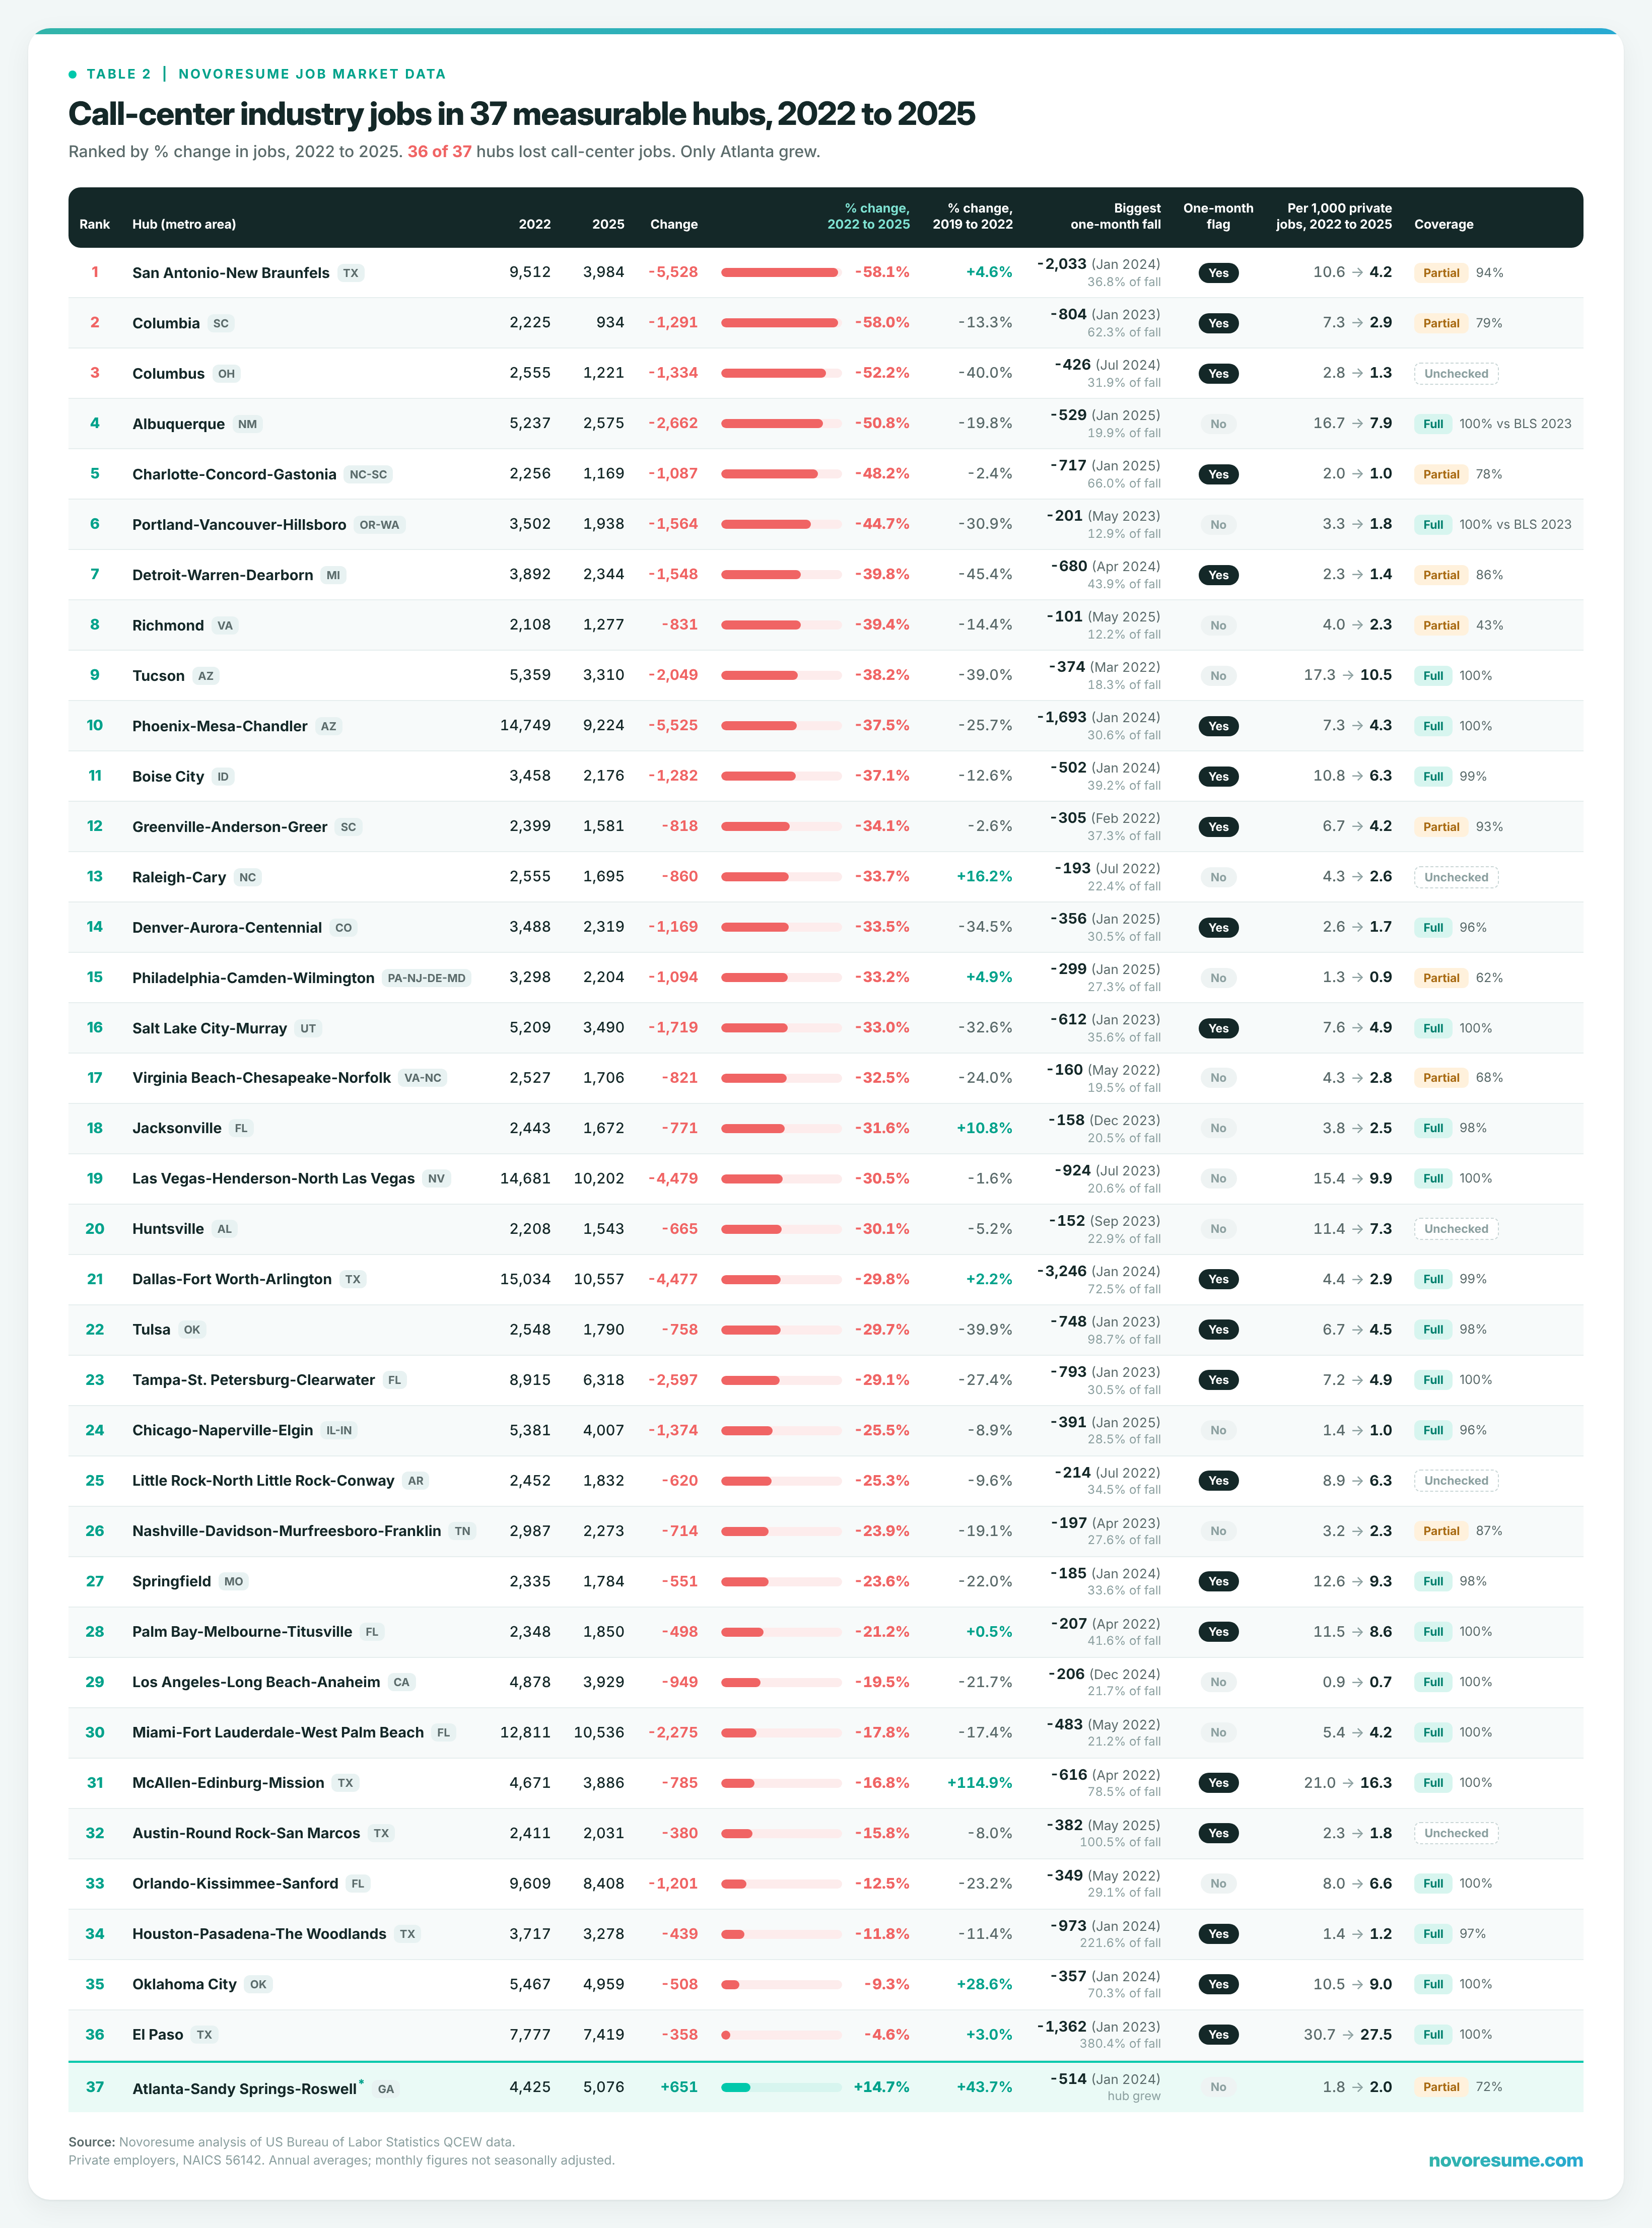
- Of the 37 hubs we can measure (2,000+ call-center industry jobs in 2022), 36 shrank, and the median hub lost 30.5%. The 37th, Atlanta, is only partly visible in the data (see below).
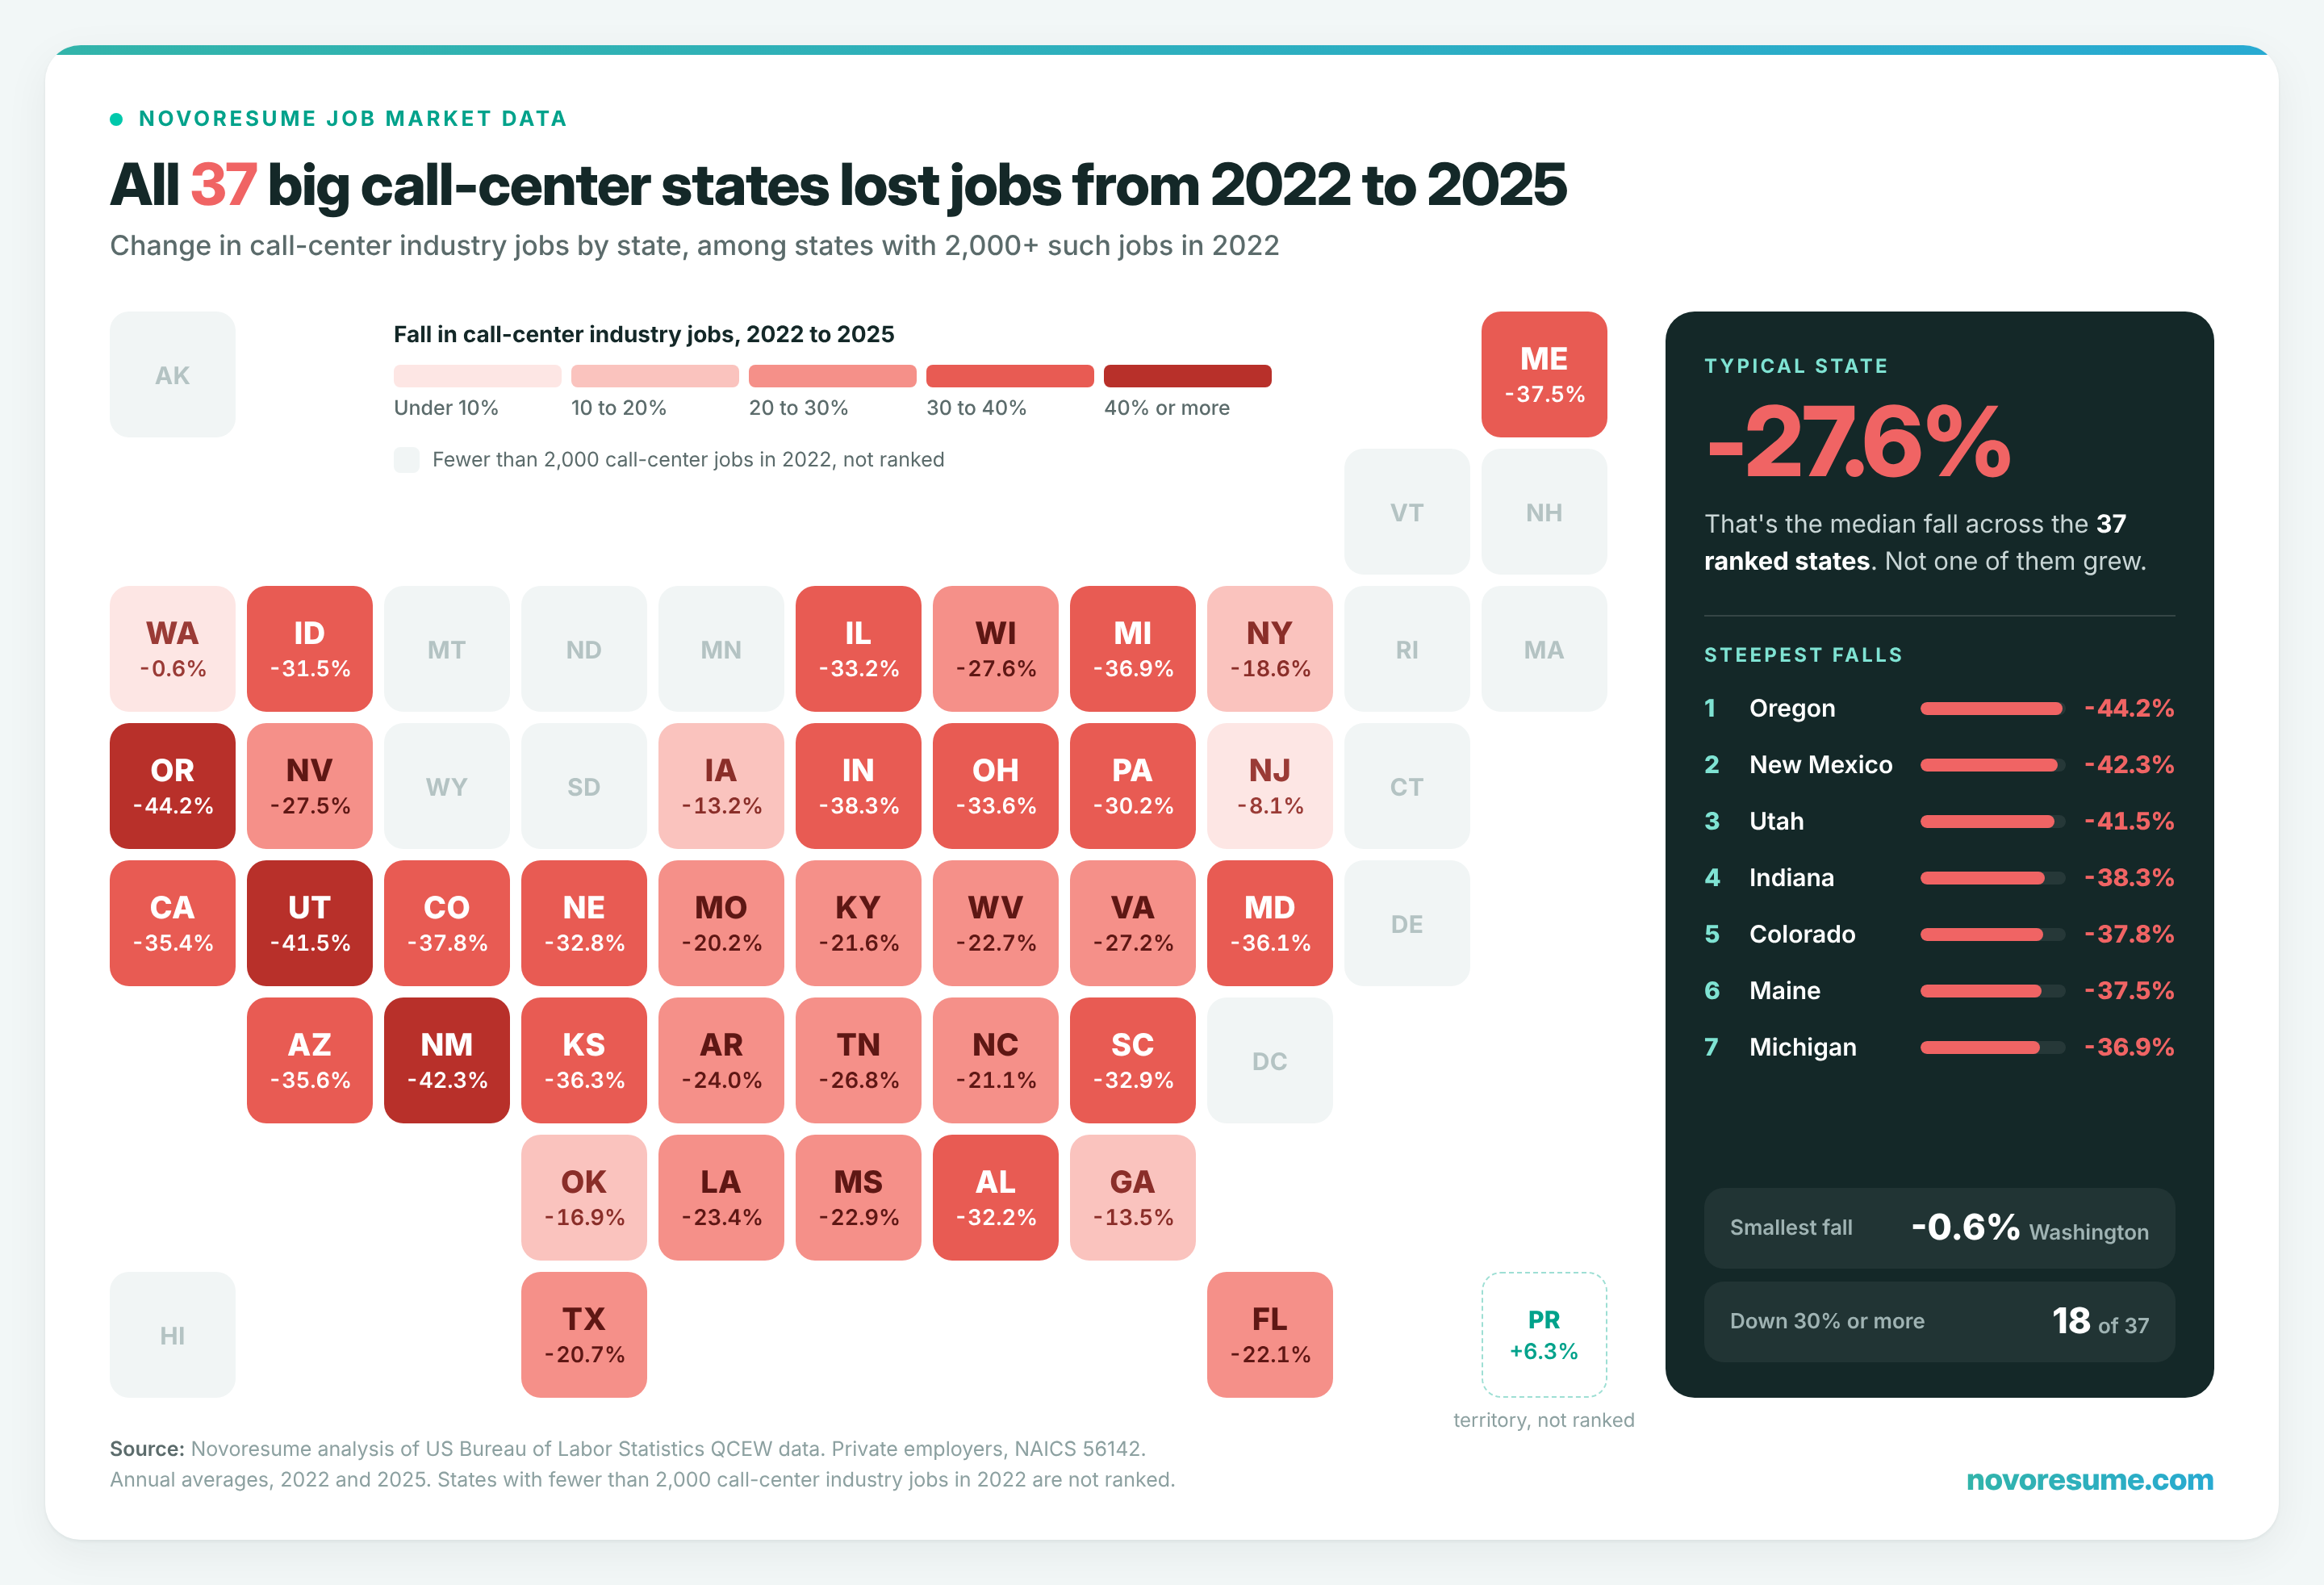
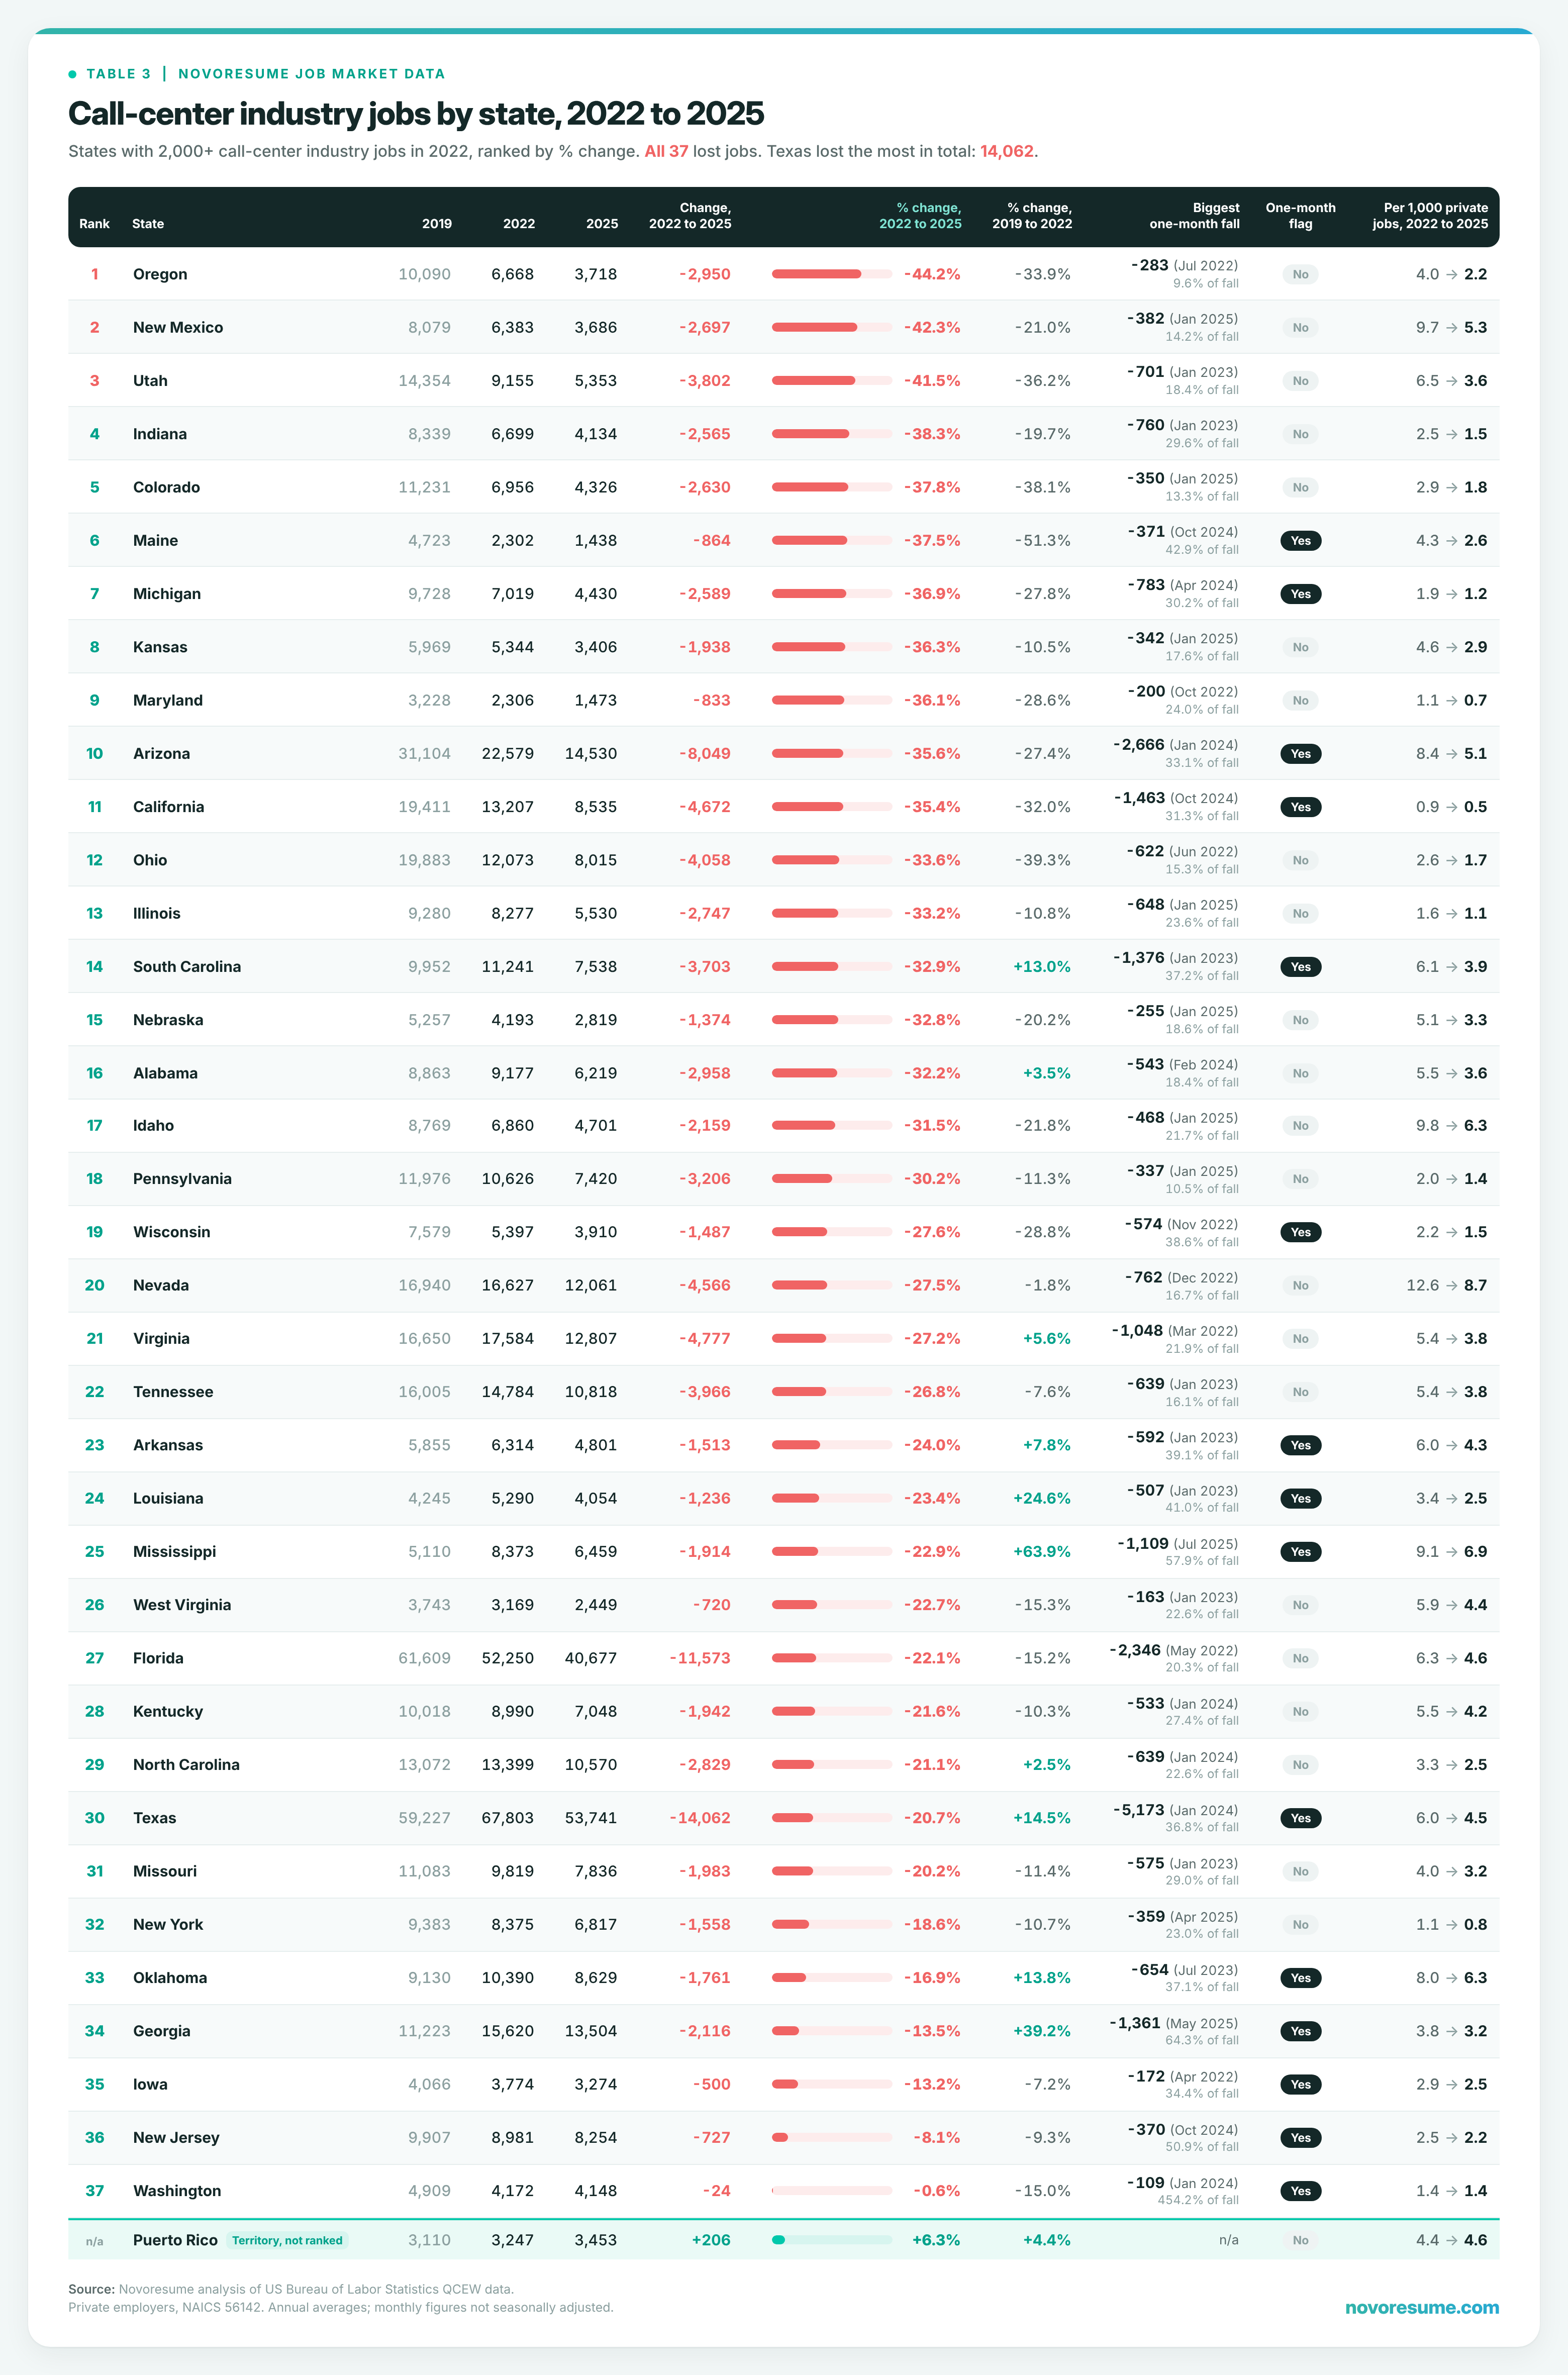
- All 37 states with 2,000+ call-center industry jobs in 2022 had fewer in 2025. Among them, Oregon fell most (down 44.2%), then New Mexico (42.3%) and Utah (41.5%). Oregon and Utah were already down 33.9% and 36.2% from 2019 to 2022.
- Call-center industry workplaces with 250+ staff fell by 44%, from 458 to 257 between the first quarter of 2022 and the first quarter of 2026. Call-center industry jobs at those workplaces fell from 270,564 to 145,052.
US call-center industry jobs since ChatGPT launched: the national picture
The fall started before ChatGPT
Big call-center workplaces fell by 44%
Call-center industry jobs in the 13 biggest US hubs we can measure
How to read the tables
Call-center industry jobs by metro hub: 37 hubs ranked
Call-center industry jobs by state: 37 states ranked
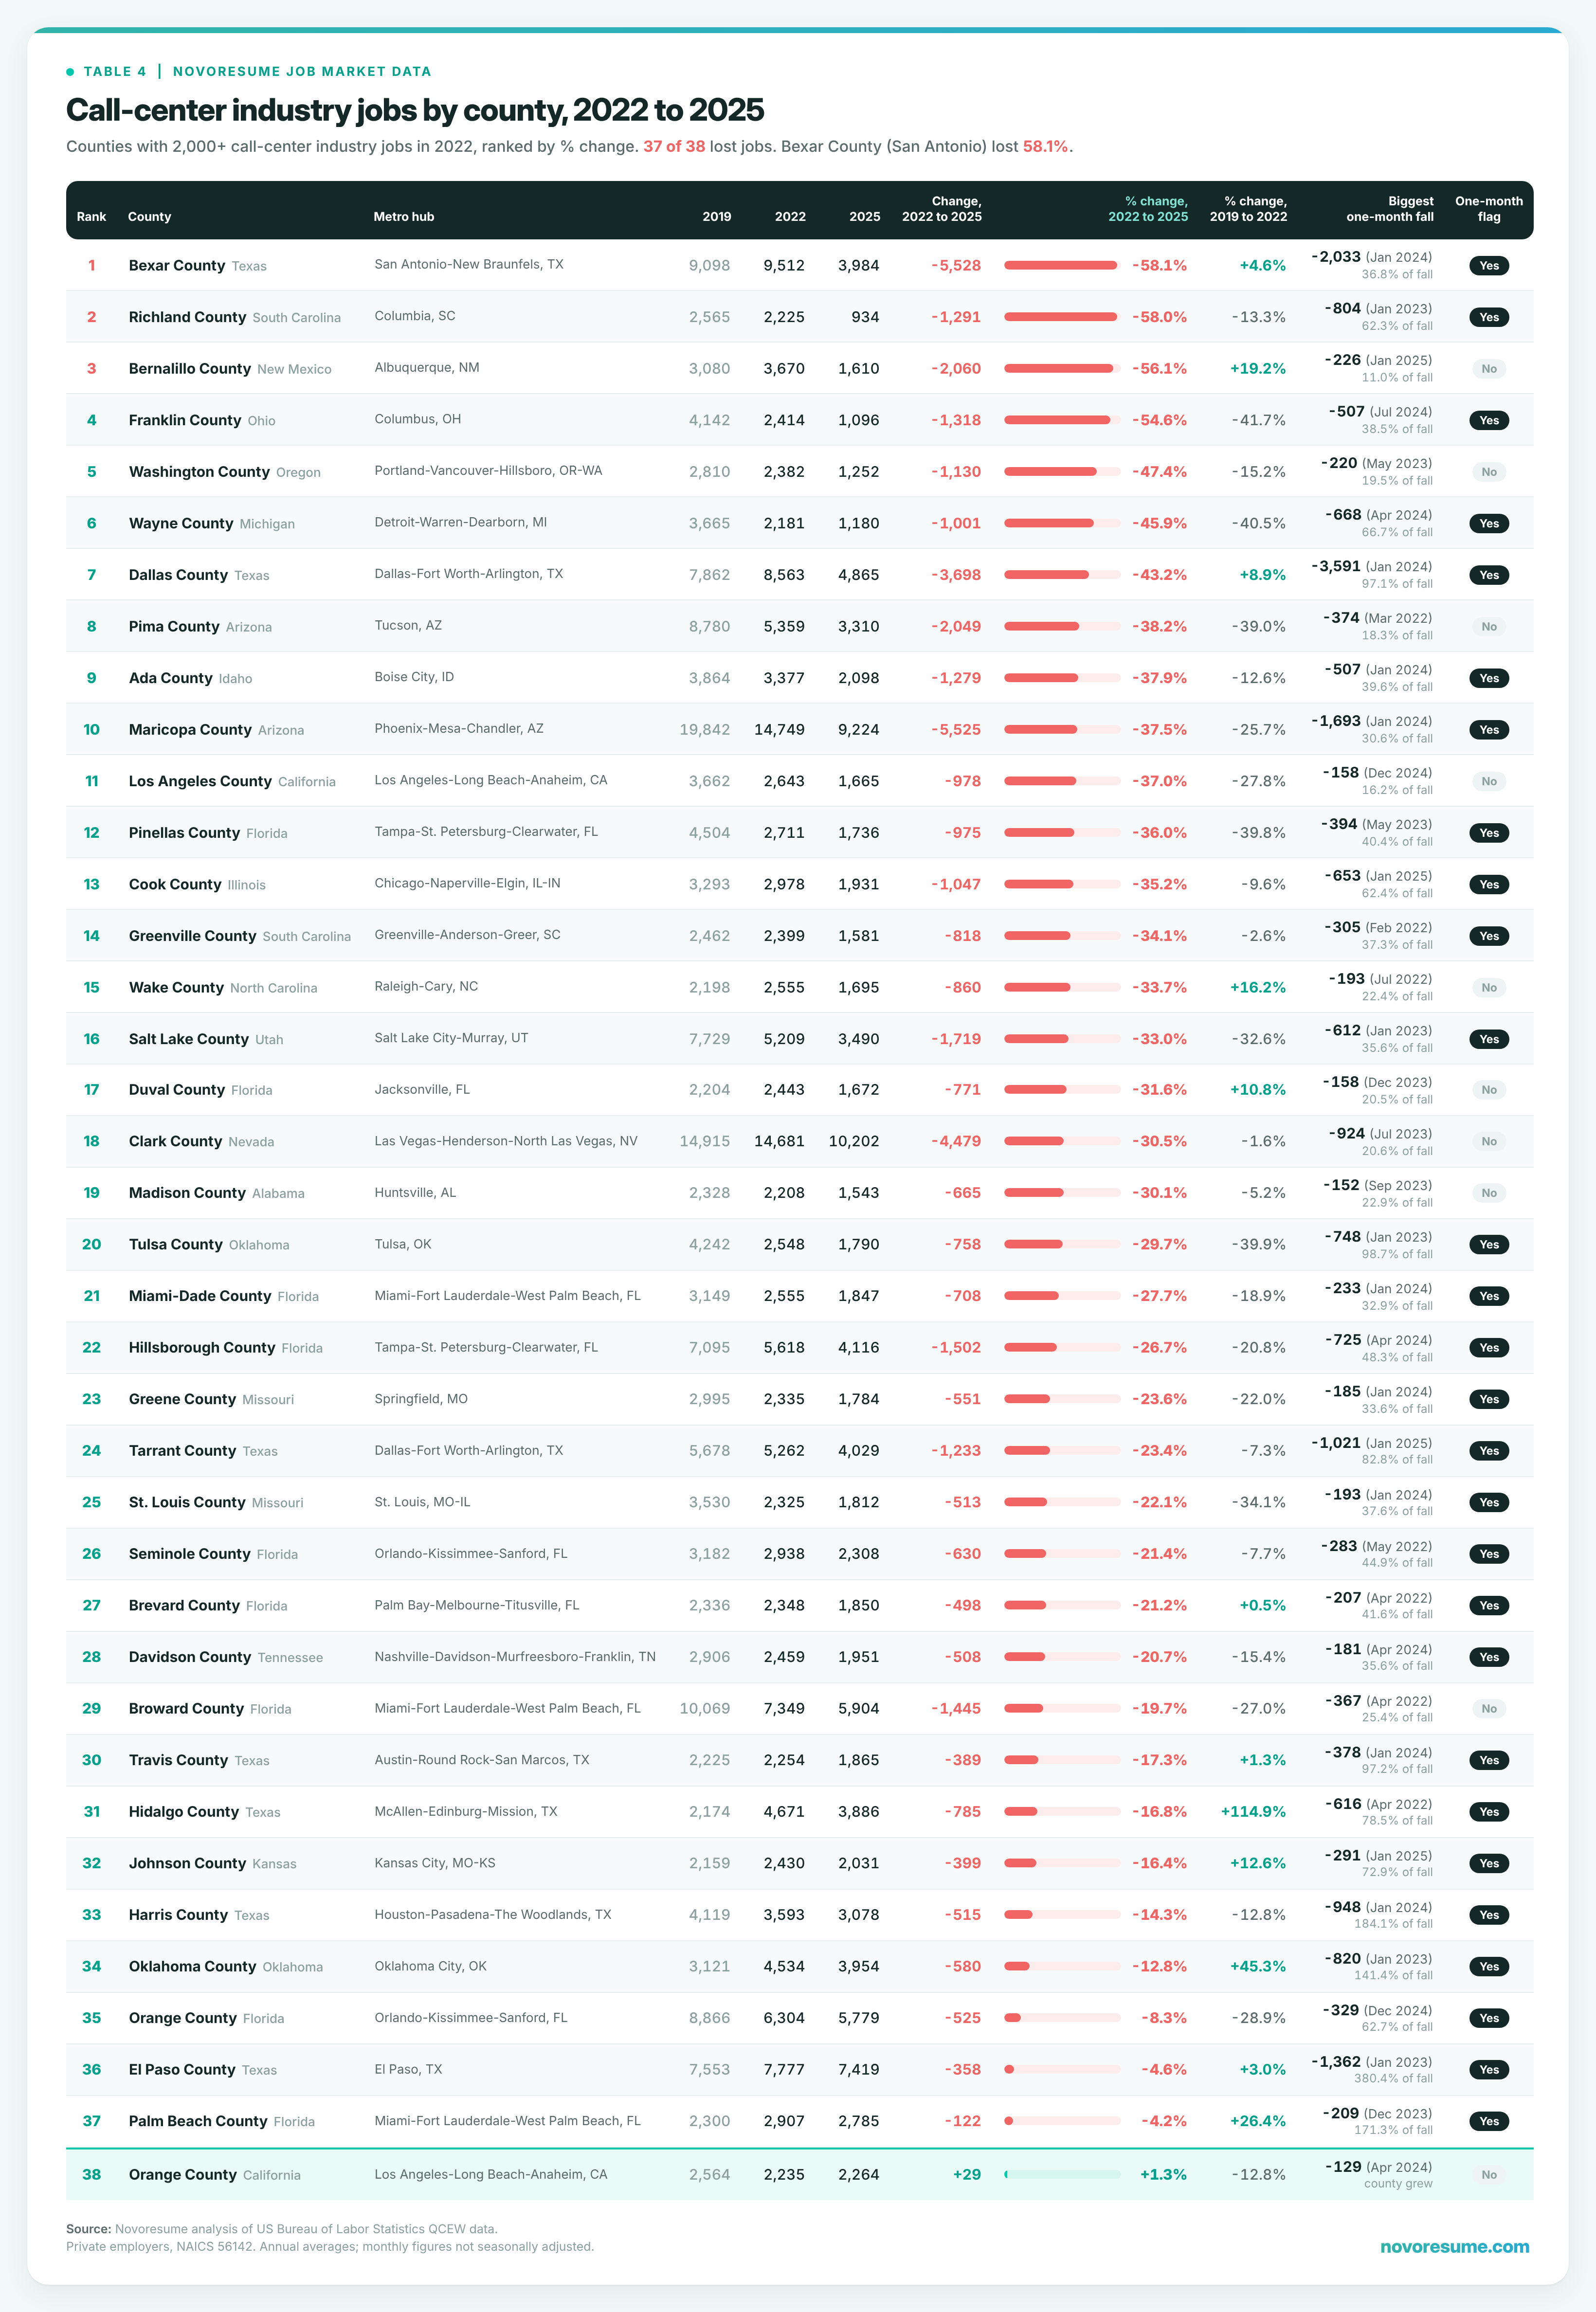
Call-center industry jobs by county: 38 counties ranked
What this data can and cannot tell you
- It shows change, not cause. QCEW counts jobs. It cannot separate AI tools from offshoring, lost contracts, remote work or other changes, all of which ran over the same years. This study measures what happened to call-center industry jobs since ChatGPT launched, not why.
- It covers the call-center industry, not every customer service job. Outsourced call-center firms and stand-alone contact centers are in. In-house customer service teams at banks, insurers, airlines and telecom firms are usually counted in those firms' own industries. For scale, BLS's occupational survey estimated 2,595,750 customer service representatives across all industries in May 2025. The call-center industry had 327,577 jobs of all kinds in 2025.
- The decline began before ChatGPT. The industry peaked in 2016 and has shrunk every year since 2017, and the fall sped up during 2022, before ChatGPT launched. Some places fell about as fast from 2019 to 2022 as from 2022 to 2025, including Tucson (39.0%, then 38.2%), Salt Lake City (32.6%, then 33.0%), Colorado (38.1%, then 37.8%) and Utah (36.2%, then 41.5%). Every table shows each place's 2019 to 2022 change.
- Some counties are hidden. BLS hides a county's figure when it could reveal a single employer. In 2025 it hid 1,159 of the 1,564 county figures for this industry. At least 11 hubs with 2,000+ call-center industry jobs in 2022 cannot be measured (listed under Table 2). Ten ranked hubs have partial coverage (Richmond covers only 43% of BLS's own metro total), and five cannot be checked. A hub that shrank to one employer can drop out of the data.
- Monthly counts move in steps. Contracts start and end, and counts often drop in January. Of the 37 hubs, 21 carry the one-month flag: 30% or more of their 2022 to 2025 fall came in a single month.
- An unexplained drop in January 2024. Call-center industry jobs often fall in January (by 2.4% in 2023, 3.0% in 2025 and 4.1% in 2026). In January 2024 they fell by 14,625 (3.8%), within that usual range. What stands out is where. Five counties carried 8,781 of that fall: Dallas County, Bexar County (San Antonio) and Harris County (Houston) in Texas, Maricopa County (Phoenix) in Arizona and DeKalb County in Georgia. Site counts barely changed, and we found no matching layoff notice in Texas WARN records or in public WARN trackers for Arizona and Georgia. Outside Maricopa County, no other industry visibly took on those call-center industry jobs. In Maricopa County, professional employer organizations gained 2,235 jobs the same month, so a move of staff onto another firm's books cannot be ruled out. The cause is unknown. The published figures keep the drop, and the Methodology shows what changes without it.
- Atlanta's figures are partial. Our Atlanta county figures cover 72% of BLS's own metro total, with 19 counties hidden, and show 651 more call-center industry jobs in 2025 than in 2022. BLS's own Atlanta metro total fell from 6,135 in 2022 to 5,329 in 2023, and BLS hides it from 2024 on.
- Small falls need care too. El Paso's call-center industry jobs fell 4.6% on annual averages and 17.9% between the first quarters of 2022 and 2026, and were flat from November 2022 to November 2025. El Paso also carries a one-month flag.
- Monthly counts are not seasonally adjusted. November is a seasonal high for the industry, so the national figure from launch compares November with November.
Sources
Methodology
- Source: US Bureau of Labor Statistics, Quarterly Census of Employment and Wages (QCEW), open-data files downloaded on October 13 and 14, 2026. QCEW counts jobs covered by unemployment insurance, as reported by employers, by county and industry.
- Industry: NAICS 56142, telephone call centers, private employers. It covers telephone answering services (561421) and telemarketing bureaus and other contact centers (561422): outsourced call-center firms and stand-alone contact-center operations. In-house customer service teams at banks, insurers, airlines and telecom firms are usually counted in those firms' own industries.
- Periods: The main measure compares annual average call-center industry jobs in 2022 with 2025. ChatGPT launched on November 30, 2022, so 11 months of 2022 came before launch. We use annual averages for places because they smooth the one-month steps that move monthly counts. As a result, places that were already falling during 2022 tend to show a bigger fall on annual averages than from November 2022 to November 2025. Utah, for example, fell 41.5% on annual averages and 34.3% from November 2022 to November 2025. The national figure from launch compares November 2022 with November 2025. Monthly counts run from January 2022 to March 2026 and are not seasonally adjusted. The national series runs from 2014. The 2019 to 2022 columns use the same method on 2019 and 2022 annual averages.
- Places: Counties are as published. Metro hubs are 2023 federal metro areas, built by adding up their counties. A metro's change is measured only on counties BLS shows in both 2022 and 2025. We rank metros with at least 2,000 call-center industry jobs in 2022 where those counties hold at least 90% of the metro's call-center industry jobs that BLS shows (37 hubs). The big-hub list uses a 5,000-job floor (13 hubs). Counties and states use a 2,000-job floor (38 counties that BLS shows in both 2022 and 2025; 37 states, with Puerto Rico shown for reference). A county missing from a BLS file has no call-center workplaces that year and counts as zero. County and metro figures leave out the jobs BLS records with no fixed county, often statewide remote staff. State and national figures include them. In the states where BLS shows them in both years, those records held 61,733 call-center industry jobs in 2022 and 61,087 in 2025, so in those states the county falls are not a move of staff into that category.
- Coverage: Our 2022 county sum compared with BLS's own metro total. Full is 95% or more, Partial is below 95%, and Unchecked means BLS published no metro total. Albuquerque and Portland are checked against BLS's 2023 metro total.
- Calculations: Change and percentage change in annual average call-center industry jobs. Per 1,000 figures divide by all private jobs in the same area and year; the loss per 1,000 divides the 2022 to 2025 fall by all private jobs in 2022. The biggest one-month fall is the largest drop from one month to the next between February 2022 and December 2025, divided by the 2022 to 2025 fall. A share of 30% or more is flagged. For metros, per 1,000 figures divide by all private jobs in all of the metro's counties, so they read low for partial metros, most of all Richmond (43% coverage).
- Workplace sizes: QCEW size classes for the first quarter of 2016, 2022, 2025 and 2026 (2026 figures are preliminary), which count reporting units by March headcount.
- January 2024 check: Removing the January 2024 drop in the five counties (8,781 call-center industry jobs) from every later month changes these results. The national fall from November 2022 to November 2025 becomes 97,125 (22.1%) instead of 105,906 (24.1%), and the fall in annual averages from 2022 to 2025 becomes 106,958 (24.1%) instead of 115,739 (26.1%). San Antonio falls 36.7% instead of 58.1%, Phoenix 26.0% instead of 37.5% and Dallas-Fort Worth 5.9% instead of 29.8%. Houston rises 13.7% instead of falling 11.8%. Arizona falls 28.2% instead of 35.6%, Texas 11.0% instead of 20.7% and Georgia 10.2% instead of 13.5%. On the 13-hub list, Albuquerque then ranks first. Apart from the metros named here, no metro moves more than two places. This is a sensitivity check, not a correction, and the tables show the published figures.
- Data vintage: Figures use QCEW data published by October 14, 2026. BLS revises QCEW each quarter, and second-quarter 2026 data, scheduled for December 2, 2026, is not included. BLS's monthly payroll survey (Current Employment Statistics) shows a similar fall for telephone call centers: 436,100 jobs in November 2022 and 329,400 in November 2025, down 24.5% (not seasonally adjusted).
 Add Novorésumé as a preferred source on Google
Get more resume writing tips, career insights, and job search advice in your personalized Google search results.
Related posts

Words and adjectives to describe yourself in interviews, on your resume, and in bios. Grouped by trait, with worked answers and the 10 words to avoid.

100+ AI hiring statistics for 2026: employer adoption, AI resumes and cover letters, interview cheating, and detection rates, from our four 2026 surveys.

90+ Gen Z workplace statistics for 2026: workforce share, the entry-level squeeze, AI, tenure, money, and the management myths. From 20+ primary sources.