Updated on August 20, 2026
100+ Job Satisfaction Statistics for 2026 (New Data)
100+ job satisfaction statistics for 2026: record-high satisfaction, sliding engagement, AI effects, burnout, and RTO. From 16 primary sources + our data.


Novoresume got people hired at
























Two long-running measures of how people feel about work are pointing in opposite directions: satisfaction is at a record high while engagement scrapes its post-pandemic floor.
Underneath the split, AI is rewriting what people like and hate about their jobs.
We compiled 100+ statistics on why both readings are true at once, from The Conference Board, Gallup, Pew Research Center, Randstad, the Bureau of Labor Statistics, and a dozen other primary sources, and 17 figures from our 1,000-worker 2026 AI Workplace survey.
Key Findings
- US job satisfaction hit 68.9% in 2026, the highest reading in The Conference Board's 39-year series.
- At the same time, only 31% of US employees are engaged at work, and global engagement fell to 20%, the lowest since 2020 (Gallup).
- Both are true at once: satisfaction and engagement measure different things, and the gap between them is the real story of 2026.
- Satisfaction splits hard by income: 45.3% of workers earning under $25,000 are satisfied versus 76% of those earning $150,000+ (The Conference Board).
- Workers who say AI improved their job satisfaction outnumber those who say it reduced it by roughly 6 to 1 (The Conference Board).
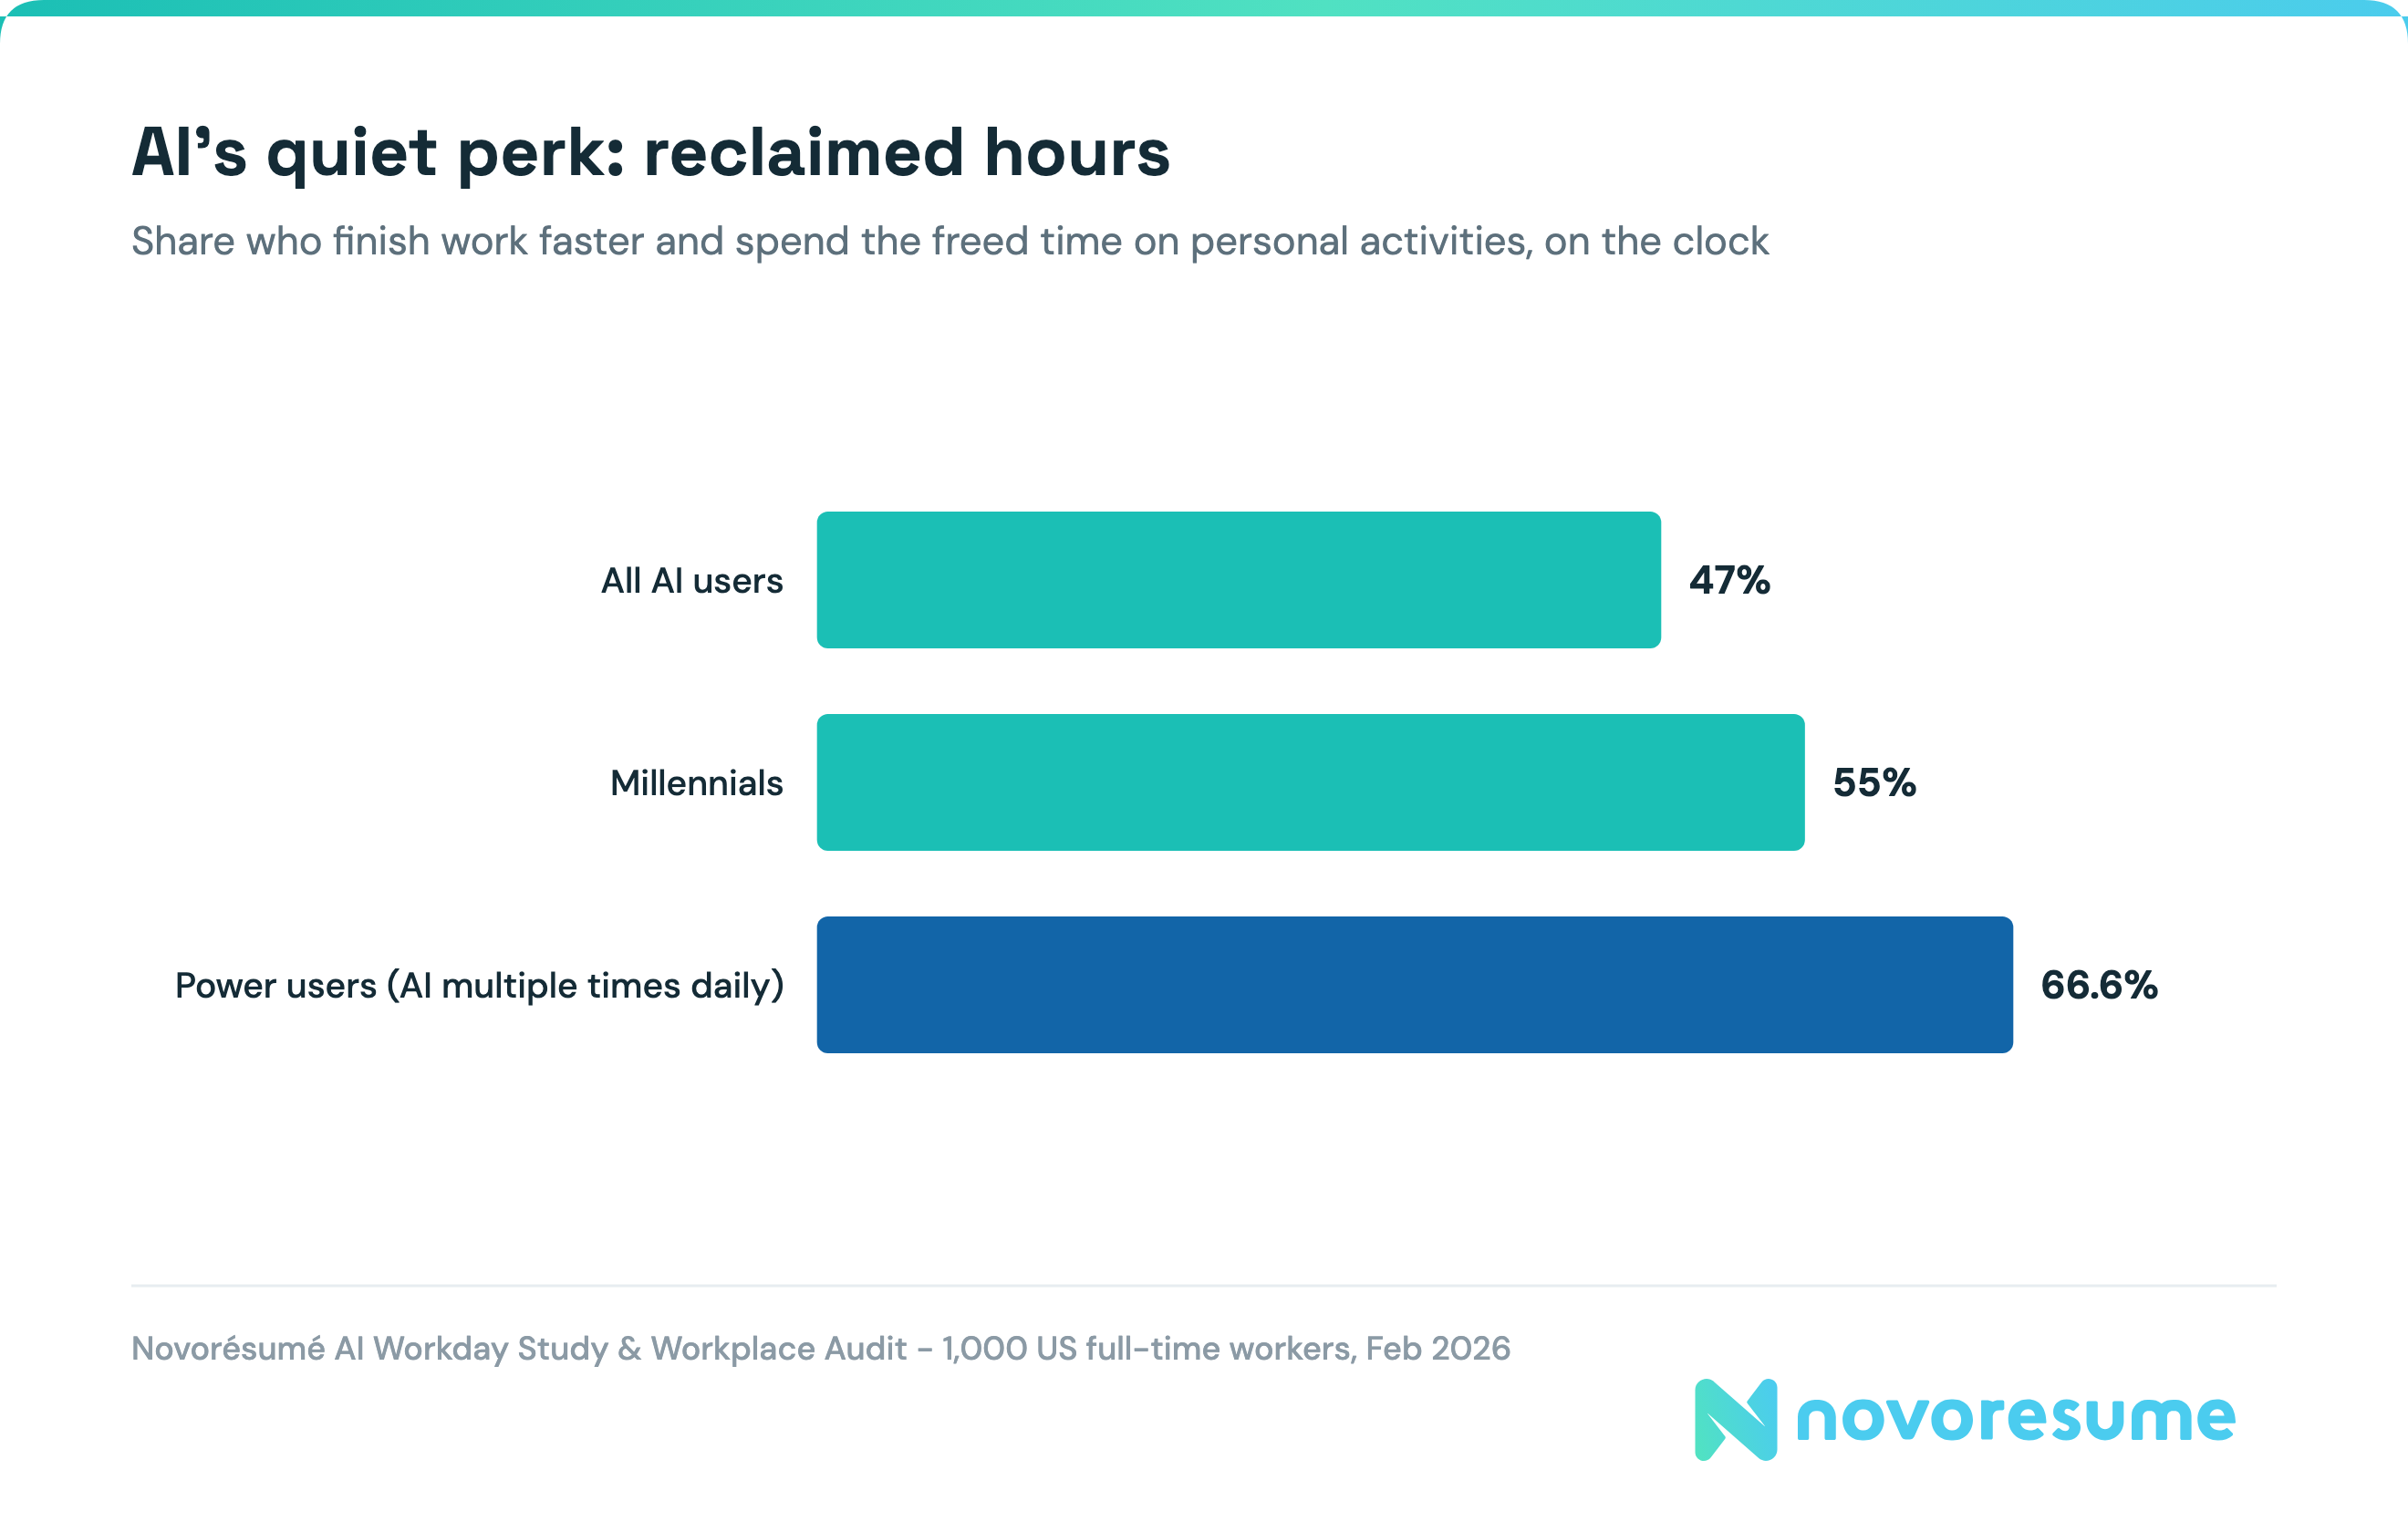
- 47% of AI-using workers finish their work faster and spend the freed hours on personal activities while on the clock, per our AI Workday Study.
- Only 30% of US workers are extremely or very satisfied with their pay, and among the dissatisfied, 80% say pay hasn't kept up with the cost of living (Pew Research Center).
- 44% of US employees report feeling burned out at work, and burned-out workers are nearly 3x more likely to be job hunting (SHRM).
- 51% of US workers are watching for or actively seeking a new job, yet the quit rate sits at just 1.9%, down from the 3.0% Great Resignation peak (Gallup; BLS).
- Low engagement costs the world economy roughly $10 trillion a year, about 9% of global GDP (Gallup).
How Satisfied Are Workers in 2026?
It depends on which ruler you use, and the honest answer needs both.
- 68.9% of US workers say they're satisfied with their job overall, the highest reading in the 39-year history of The Conference Board's survey, up from 68.3% in 2025.
- The climb has been long: satisfaction bottomed at 42.6% in 2010 after the Great Recession and has risen for 16 straight years (The Conference Board).
- The 2025 edition recorded the largest single-year jump ever measured, +5.7 percentage points, with workers reporting higher satisfaction on 26 of 27 job elements (The Conference Board).
- Under the headline number: average satisfaction across the 27 individual job elements is just 59%, roughly 10 points below overall satisfaction. People like their jobs more than they like the parts of their jobs (The Conference Board).
- Pew Research Center's stricter ruler tells a cooler story: 50% of US workers are extremely or very satisfied with their job, 38% somewhat satisfied, and 12% not satisfied (surveying 5,273 employed US adults).
- The two numbers don't contradict each other. The Conference Board counts everyone at least mildly satisfied; Pew counts only the enthusiastic top of the scale. Journalists citing either should say which.
- Recent job switchers report slightly higher satisfaction than stayers, 70.5% vs 69.6% (The Conference Board, 2025 edition subgroup data).
Are Workers Actually Engaged, Though?
No, and this is where the record-high satisfaction story falls apart.
- Only 20% of employees globally were engaged at work in 2025, down from 21% the year before and the lowest since 2020. No world region saw engagement rise (Gallup, surveying 141,444 employed adults across 140+ countries).
- Gallup puts the cost of low engagement at roughly $10 trillion in lost productivity, about 9% of global GDP.
- US engagement is stuck at 31% through the first half of 2026, unchanged for three years and down from a 36% peak in 2020; 18% of employees are actively disengaged (Gallup).
- The US workforce has 8 million fewer engaged employees than it did in 2020 (Gallup).
- Clarity is collapsing too: only 49% of US employees strongly agree they know what's expected of them at work, down from 61% in 2015 (Gallup).
- Managers are cracking fastest: global manager engagement fell from 27% to 22% in a single year, the largest drop on record, and Gallup attributes about 70% of team engagement variance to the manager.
- The US/Canada region is simultaneously the most engaged region in the world (31%) and the most stressed (50% report daily stress), a paradox no other region matches (Gallup).
About the internet's favorite number: "85% of people hate their jobs" is a mangled reading of Gallup's 2017 engagement data, where 85% were "not engaged or actively disengaged." Not engaged doesn't mean hate. The same misreading produces "70% of Americans hate their jobs" from the US engagement figure. The real 2026 numbers are above, and they're bleak enough without the exaggeration.
What Actually Drives Job Satisfaction?
People love their coworkers and distrust their pay. The ranking is remarkably consistent across sources.
- What US workers are most satisfied with, per Pew: relationship with coworkers (64% highly satisfied), relationship with their manager (59%), commute (58%), flexibility to choose hours (49%), remote-work opportunities (37%), pay (30%), and promotion opportunities (26%).
- Pay satisfaction is falling: 30% highly satisfied, down from 34% a year earlier (Pew).
- Among workers who are unhappy with their pay: 80% say it hasn't kept pace with the cost of living, 71% say it's too low for the quality of their work, and 70% say it's too low for their workload (Pew).
- The Conference Board's top satisfaction drivers are intrinsic and cultural: interest in work, quality of leadership, workplace culture, workload, and supervisor relationships.
- Pay attracts, balance retains: 81% of workers name pay the top attractor to a new job, but 46% cite work-life balance as what keeps them in a role, exactly twice the 23% who cite pay (Randstad Workmonitor, surveying 27,062 workers across 35 markets).
- The manager bond is strengthening even as leadership trust erodes: 72% say they have a strong relationship with their manager, up from 64% in 2024, while trust in senior leadership fell from 77% to 72% (Randstad).
- The career ladder itself is losing believers: 72% of employers admit the linear ladder is outdated, and only 41% of workers want traditional progression (Randstad).
Who Is Most (and Least) Satisfied?
The averages hide brutal gaps.
- Income is the sharpest divide: 45.3% of workers earning under $25,000 are satisfied versus 76% of those earning $150,000 or more (The Conference Board).
- Pew sees the same gradient: 41% of lower-income workers are highly satisfied versus 53% of middle-income and 54% of upper-income workers.
- Men report higher satisfaction than women on 26 of 27 job elements, with the widest gaps on wages (+7.2 points), health plans (+7.0), retirement plans (+6.3), and promotion policy (+6.2). Work-life balance is the only element where women score higher (The Conference Board).
- Age is a satisfaction ladder: 57.4% of workers under 25 are satisfied versus 72.4% of those 55 and older, and under-25s were the only age group whose satisfaction declined in 2025 (The Conference Board).
- Pew's version of the gradient is as follows: 43% of workers under 30 are highly satisfied, rising through 48% (30-49) and 56% (50-64) to 67% at 65+.
- By race: 55% of White workers are highly satisfied versus 44% of Hispanic, 43% of Black, and 42% of Asian workers (Pew).
- Self-employment buys satisfaction: 60% of the self-employed are highly satisfied versus 49% of everyone else (Pew).
- Blue-collar workers trail on almost everything: 43% are highly satisfied (vs 53% of other workers), 25% satisfied with pay, and only 31% believe most Americans respect their work. 54% call their job "just a job to get by" (Pew, surveying 1,004 blue-collar workers).
How Do Gen Z and Millennials Define Satisfaction?
Differently enough that Gen Z workplace behavior gets its own statistics page. The headlines:
- A sense of purpose is a satisfaction requirement for 89% of Gen Z and 92% of millennials (Deloitte, surveying 23,482 across 44 countries).
- The ladder has lost them: only 25% of Gen Z and 21% of millennials prefer fast-track promotion, while 44-45% favor steady progress, and just 6% name reaching a leadership position as their primary career goal (Deloitte, 2026 edition).
- Half of both generations (50% of Gen Z, 49% of millennials) cite stress and burnout as a reason to avoid leadership roles (Deloitte).
- 74% of Gen Z and millennials now use AI daily at work, and the cost shows: 58% of Gen Z and 54% of millennials report digital fatigue (Deloitte).
Is AI Making Work More or Less Satisfying?
This is the newest fault line in the data, and it's where our own research goes deepest. Our 2026 AI Workplace Audit surveyed 1,000 US full-time workers about what AI actually does to their workday.
- 86% of US full-time workers now use AI tools for work, per our AI Workday Study.
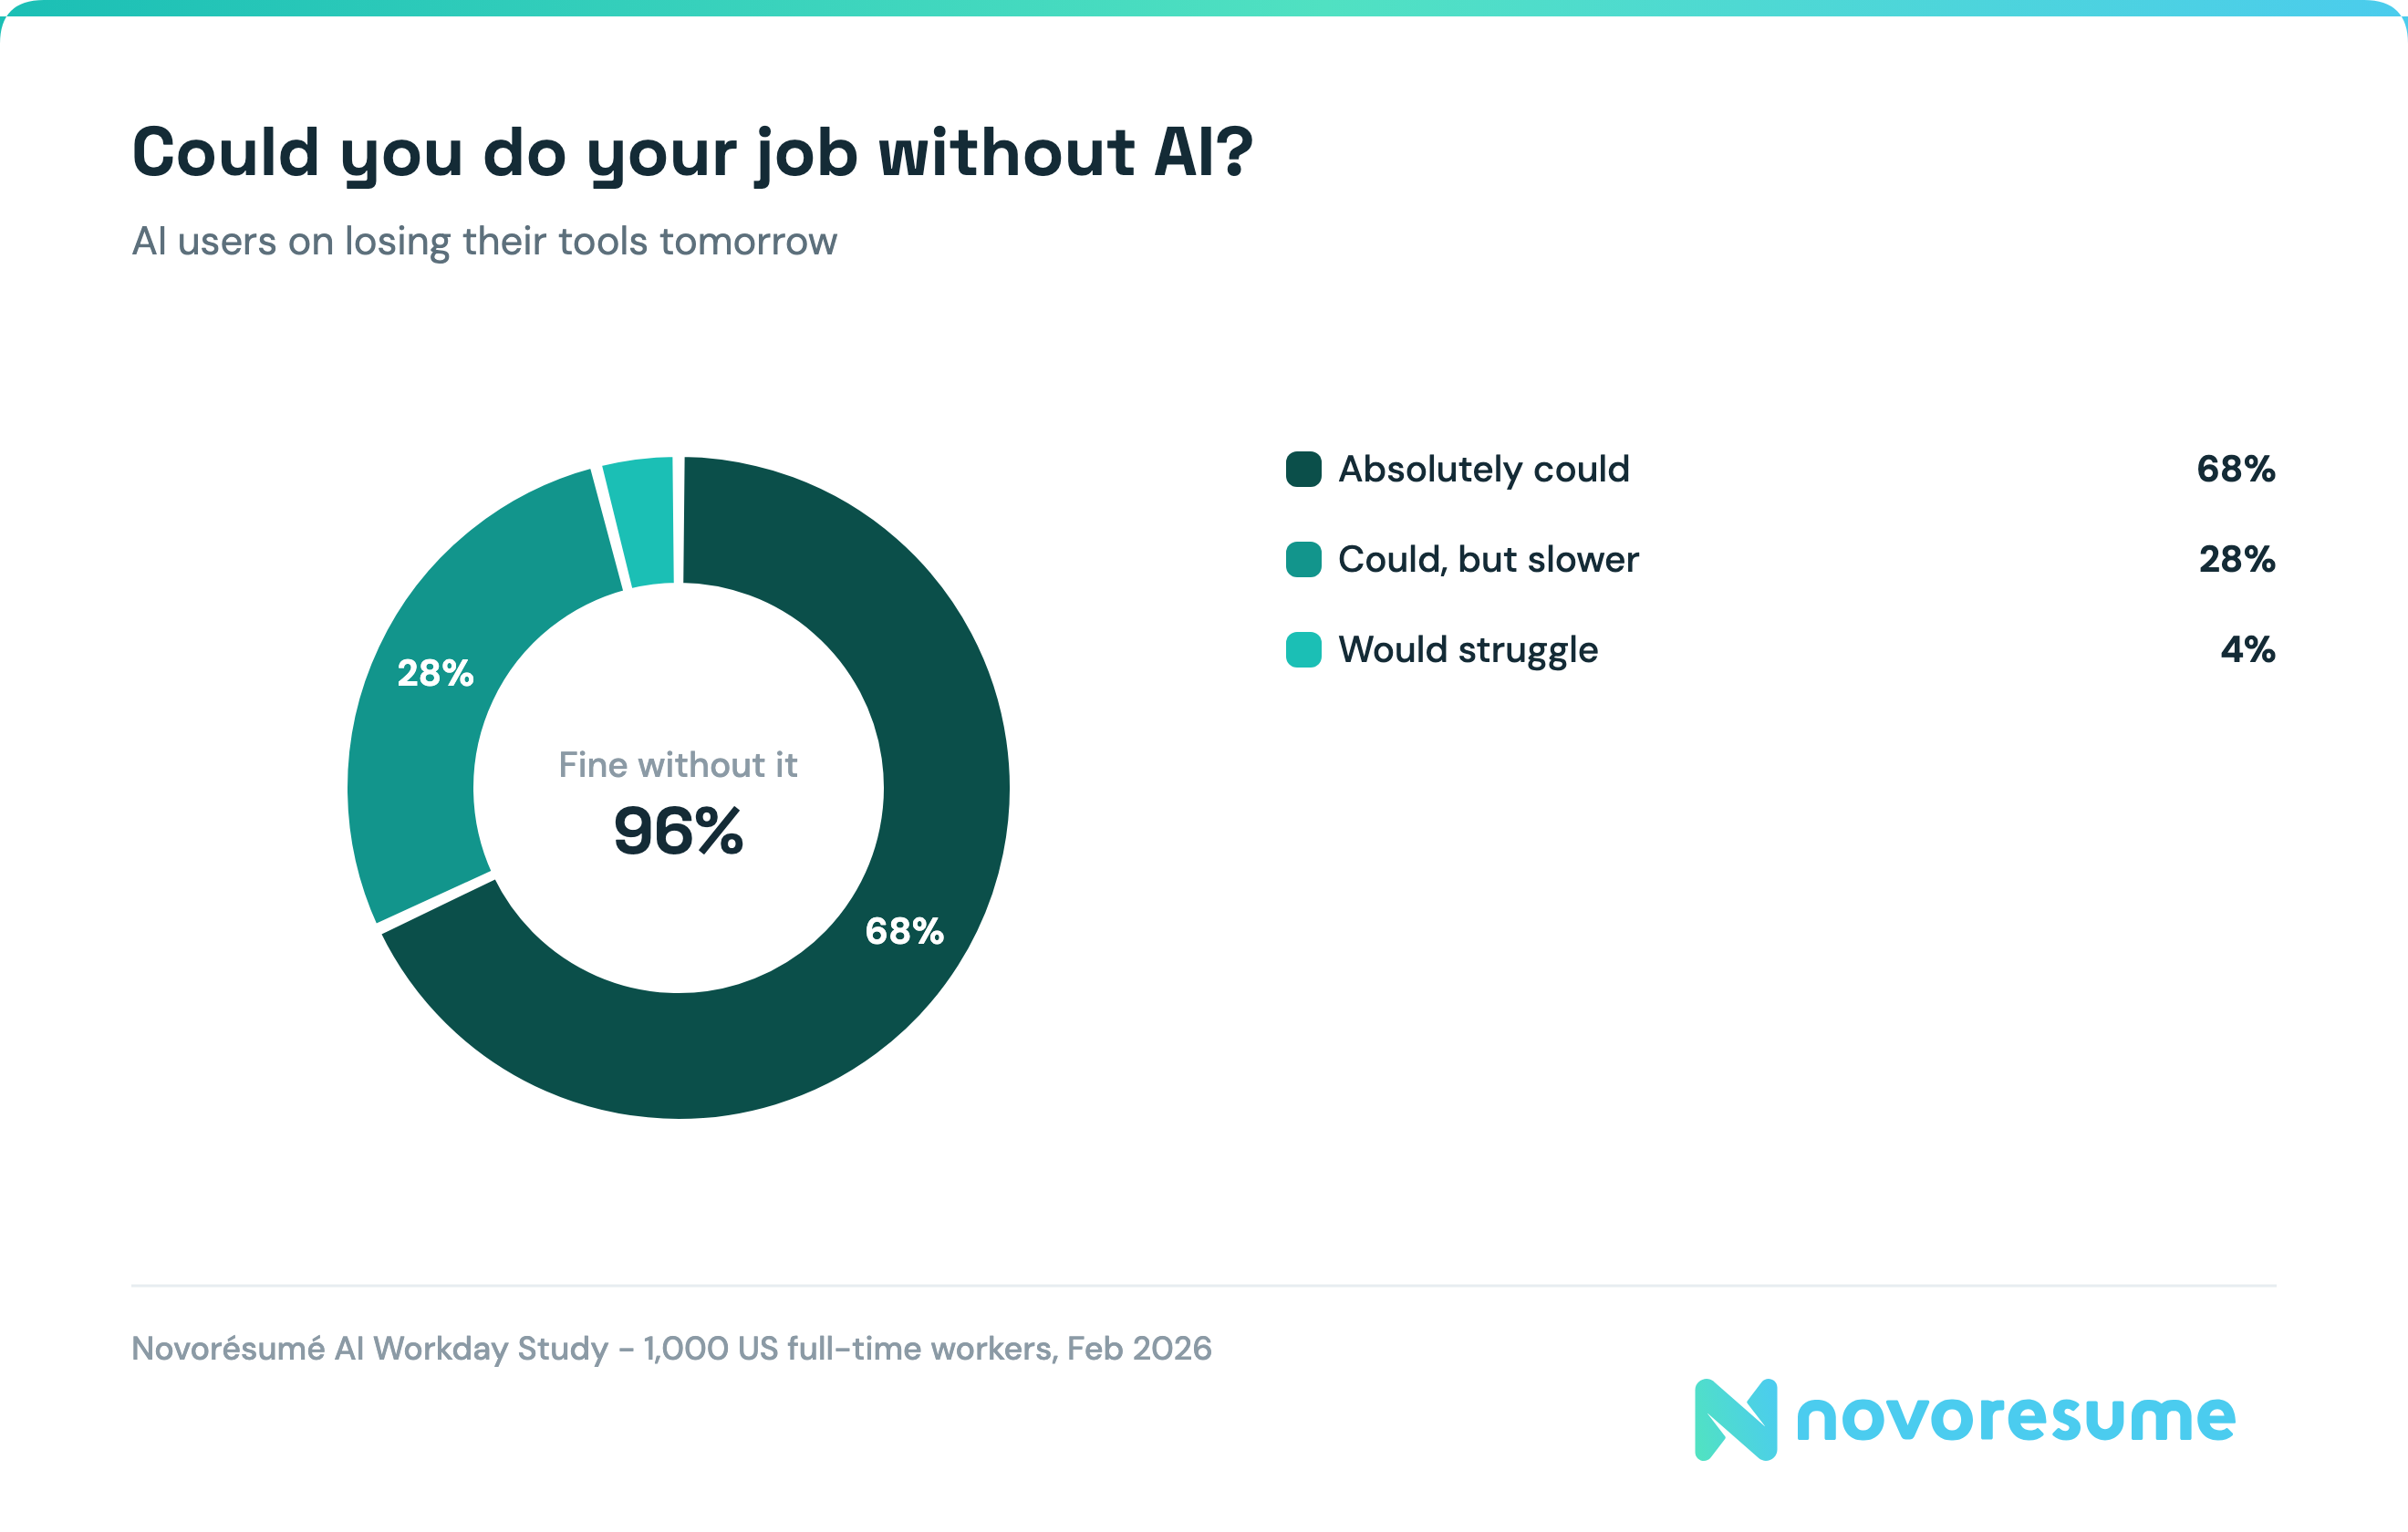
- 58% say their job is safe from AI entirely, and only 4% would struggle to do their job without it.
- The biggest satisfaction effect nobody talks about is time: 47% of AI-using workers finish their work faster and spend the freed hours on personal activities while on the clock. Millennials lead at 55%, and power users who run AI multiple times daily hit 66.6% (our AI Workday Study).
- Dependence stays low: 68% could drop AI tomorrow and absolutely still do their job, 28% could but slower, and 4% would struggle (Novorésumé AI Workday Study).
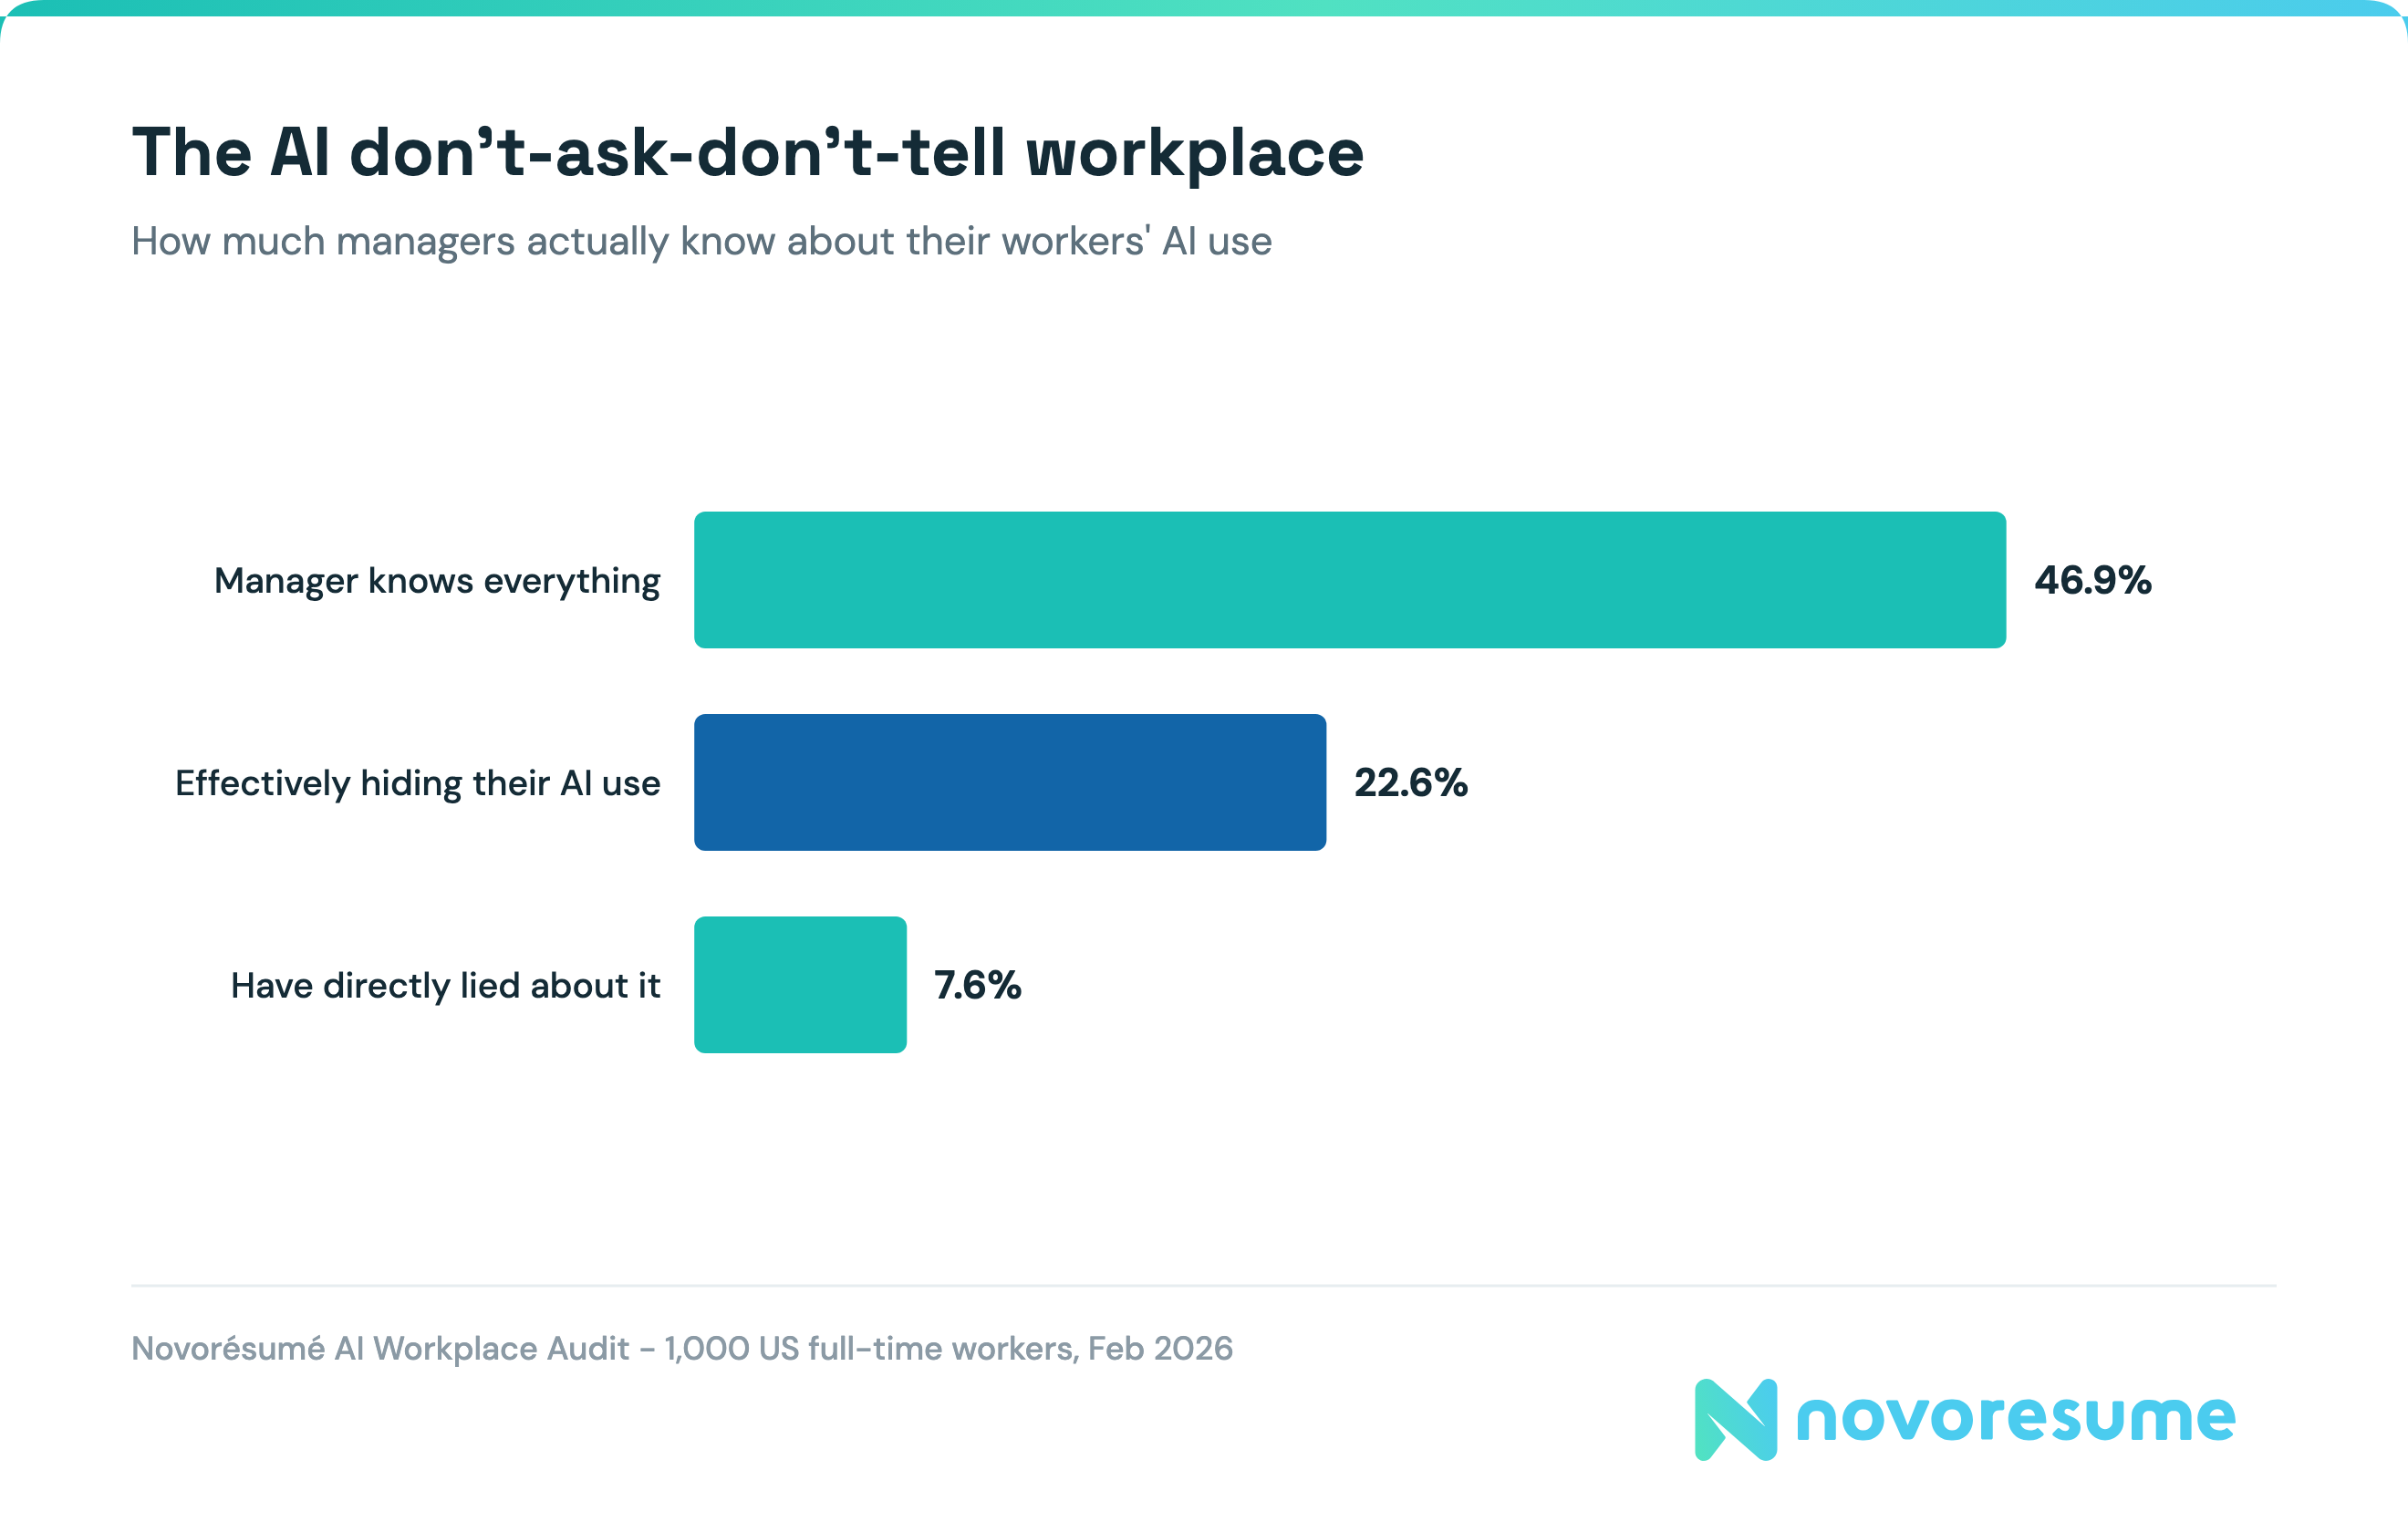
- Transparency is the stress point: only 46.9% of AI users say their manager knows everything about their AI use, 22.6% are effectively hiding it, and 7.6% have directly lied about it, per our AI Workplace study.
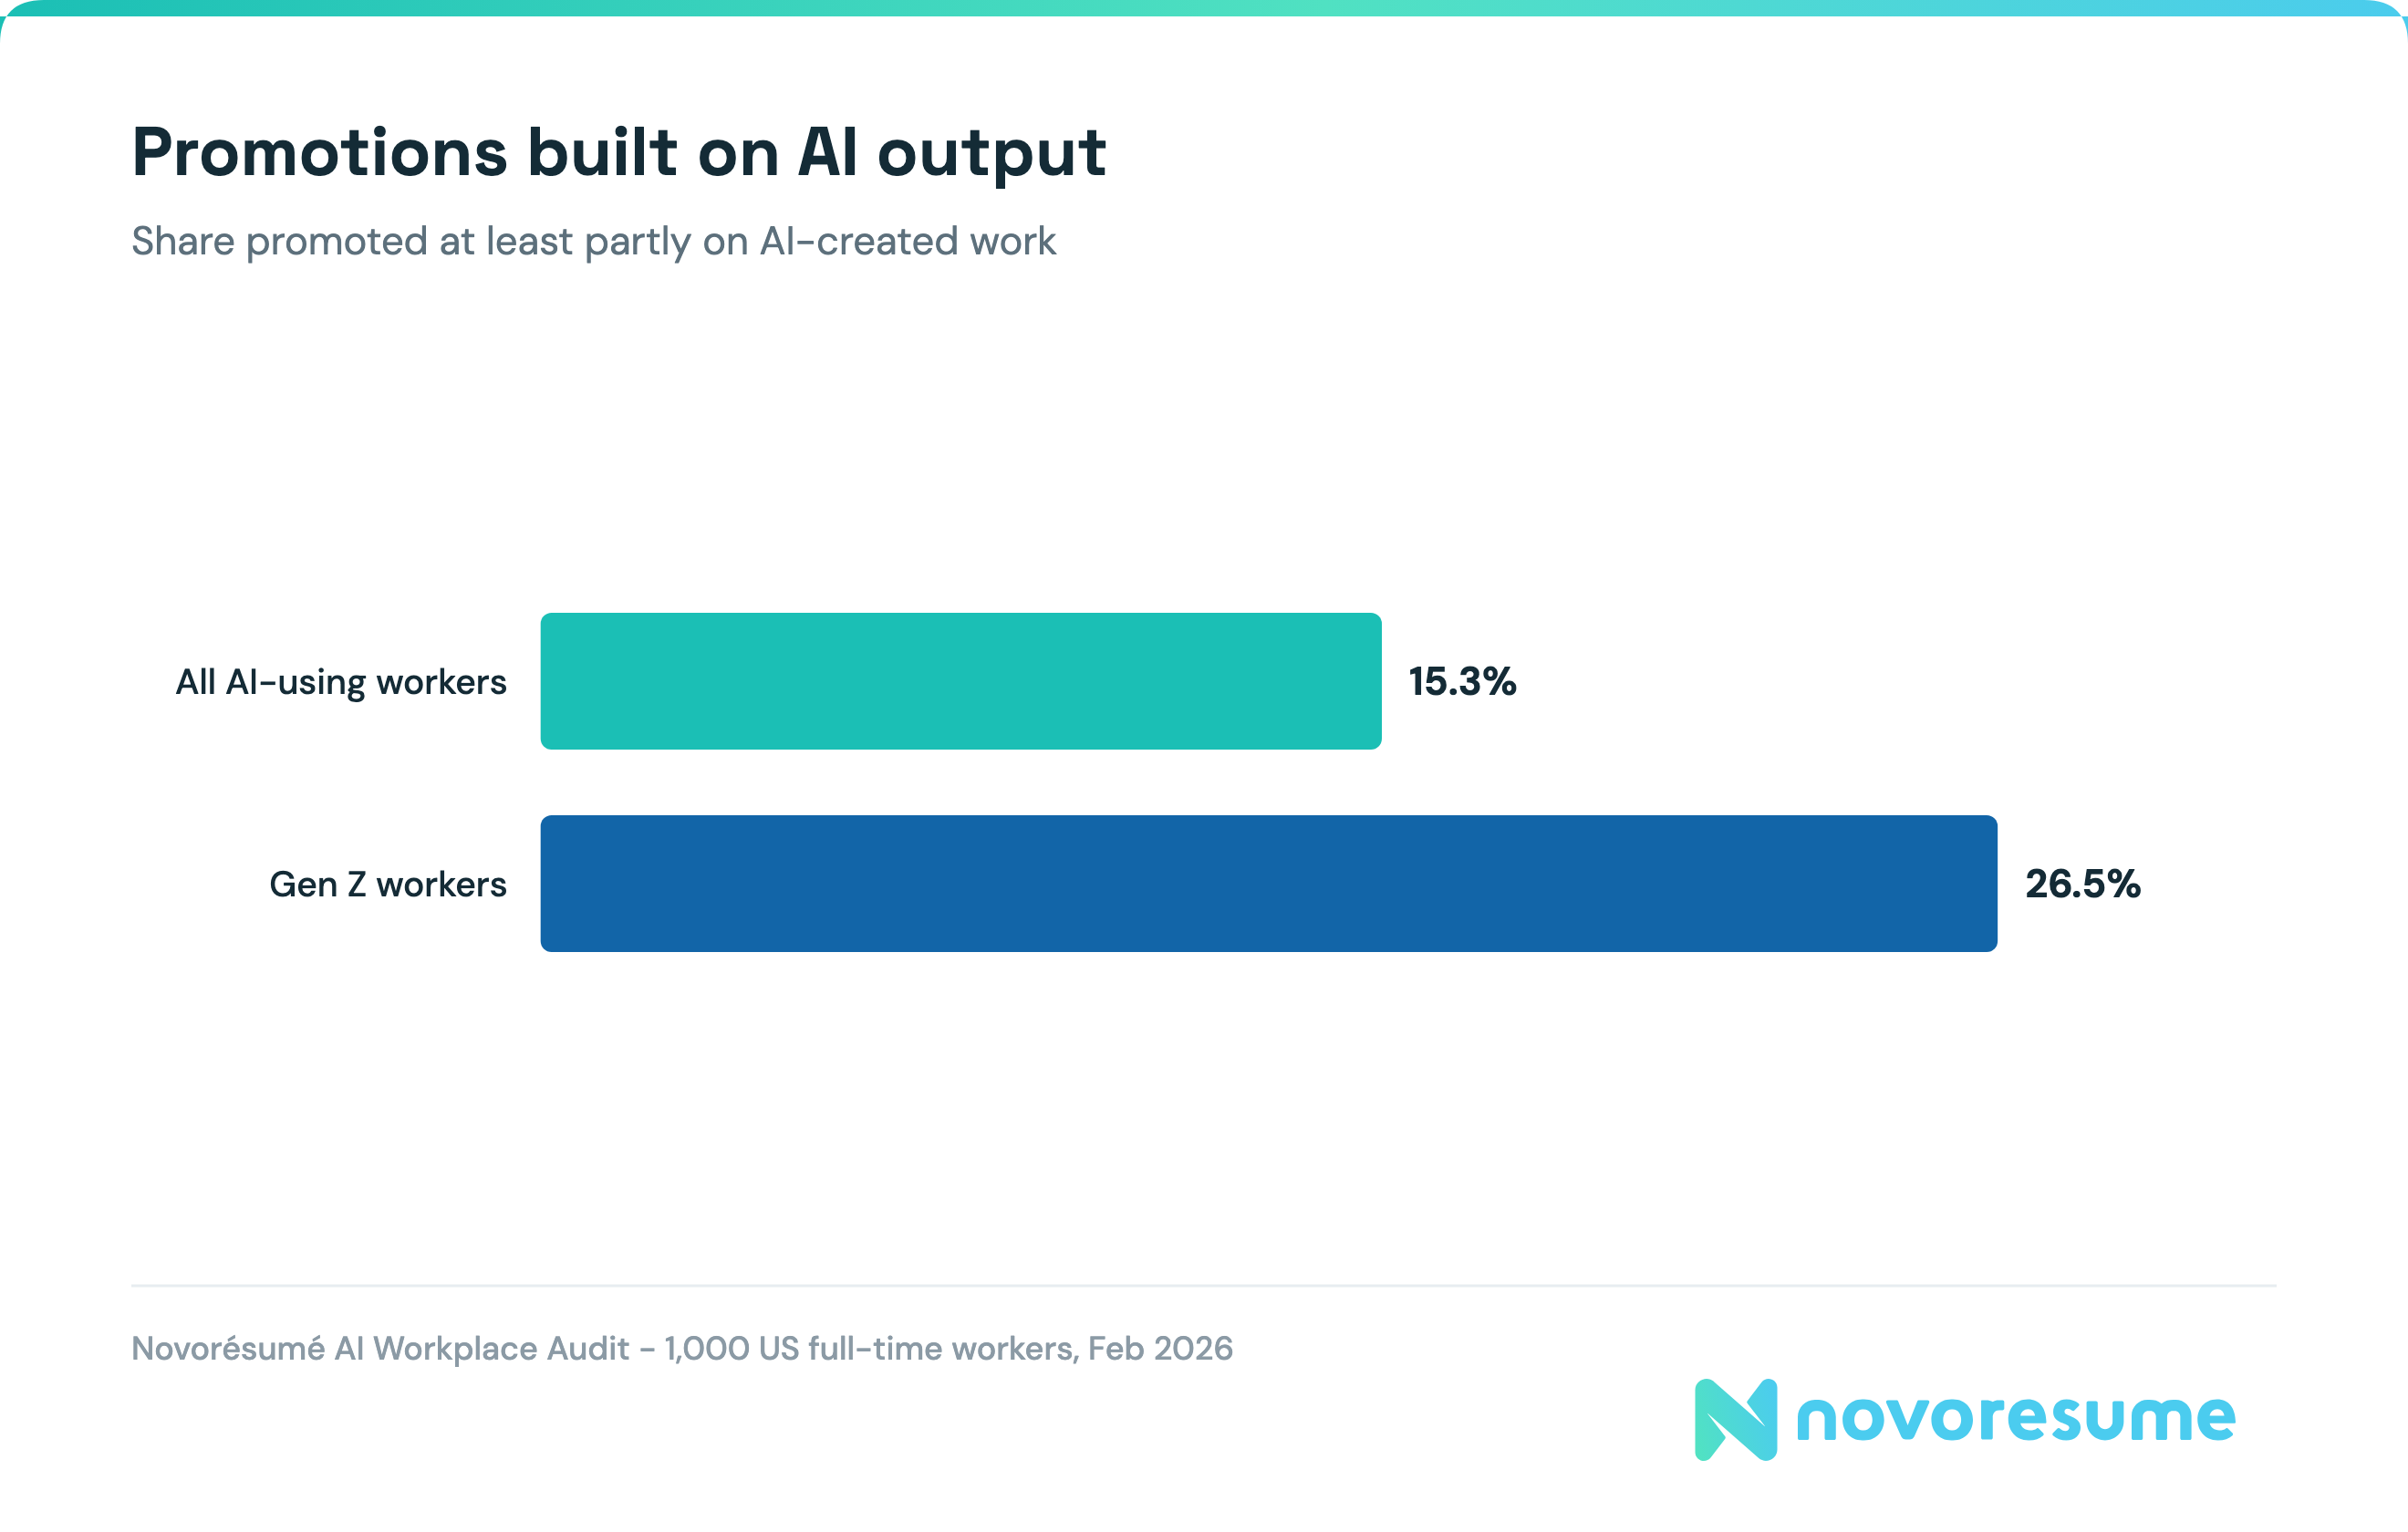
- The rewards are real, which is why people keep quiet: 15.3% of AI-using workers have been promoted at least partly on AI-created output. For Gen Z, it's 26.5% (our AI Workplace Audit).
- 37.4% have submitted work fully or almost fully generated by AI, and 9% do it regularly (our AI Workplace Audit).
- The skill effects cut both ways: 18.8% have noticed their professional skills getting rusty since adopting AI, while 13.8% say their skills improved (our AI Workplace Audit).
Our workplace audit says the average AI user isn't afraid of the tool: 58% call their job safe from AI, and 96% could do the job without it. The anxiety lives where policy is unclear, in the 22.6% who hide their AI use from their manager. Clear AI rules are the cheapest job-satisfaction upgrade a company can buy in 2026.
The external trackers land in the same place:
- Workers who say AI improved their job satisfaction outnumber those who say it reduced it by roughly 6 to 1: 39.3% improved vs 6.7% reduced (The Conference Board).
- Employee engagement runs 6 points higher in organizations that adopted AI, and where frequent use, a clear integration plan, and manager support all align, engagement hits 53% against the 31% national average (Gallup, July 2026).
- A clear AI plan alone adds a 15-point engagement premium, and employees whose managers support AI use show 48% engagement versus 30% without (Gallup).
- The anxiety underneath: 47% of workers fear AI benefits the company more than themselves, and only 21% believe their tasks are immune to AI efficiencies (Randstad).
- The workload backdrop makes AI's time savings land harder: Microsoft telemetry shows the average worker is interrupted 275 times a day, receives 117 emails and 153 chat messages per weekday, and after-8 pm meetings are up 16% year over year. 1 in 3 employees says the pace of the last five years makes it impossible to keep up (Microsoft Work Trend Index, June 2025).
How Stressed and Burned Out Are Workers?
- 40% of employees worldwide experienced significant stress the previous day; the US/Canada region leads the world at 50% (Gallup).
- The rest of the daily-emotions dashboard: 22% felt anger, 23% sadness, 22% loneliness. Life evaluation ("thriving") sits at 34%, its first rise in three years (Gallup).
- 44% of US employees feel burned out at work, 45% feel emotionally drained, and 51% feel used up at the end of the workday (SHRM, 2024).
- Belonging is protective: employees with strong organizational belonging are 2.5 times less likely to burn out (SHRM, 2024).
- Job insecurity became a majority stressor: 54% of US workers say it significantly affects their stress levels at work, 39% worry policy changes could cost them their job within a year, and 44% fear an economic downturn could, up from 36% in 2024 (American Psychological Association, surveying 2,017 workers).
- Stress spills over: among the economically worried, 42% report work stress hurting their sleep and 36% report strain on their relationships (APA).
- Burnout converts directly into turnover risk: 45% of burned-out US employees are actively job hunting versus 16% of everyone else, and they're far less likely to go above and beyond (40% vs 56%) (SHRM, 2024).
- Distrust is showing up in the language workers use: Glassdoor reviews mentioning "misalignment" with leadership rose 149% in a year, "distrust" 26%, and "disconnect" 24%. Small layoffs of under 50 people now make up 51% of all layoffs, up from 38% in 2015, a drip-feed Glassdoor links to chronic anxiety (Glassdoor Economic Research).
Are Dissatisfied Workers Actually Quitting?
Mostly no, and that tension defines the 2026 labor market.
- 51% of US workers are watching for or actively seeking a new job: 40% watching, 11% actively applying (Gallup).
- Only 28% say now is a good time to find a quality job, down from 70% in mid-2022, the largest confidence collapse Gallup has recorded.
- Employee confidence hit a record low: just 43.8% of employees reported a positive six-month business outlook in April 2026, the lowest in the index's history (Glassdoor Economic Research).
- But the quits data says people are staying put: the US quits rate is 1.9%, flat for over a year and far below the 3.0% Great Resignation peak of April 2022. Americans quit at 2016-era rates now (Bureau of Labor Statistics, May 2026).
- In raw numbers, 3.1 million people quit in May 2026, versus roughly 4.5 million a month at the 2022 peak (BLS).
- Globally, 52% of workers say it's a good time to find a job; the US/Canada is the most pessimistic region at 47% (Gallup).
- When people do move, it works out slightly more often than staying: job switchers report 70.5% satisfaction vs 69.6% for stayers (The Conference Board).
The quits rate says people are staying, and the sentiment data says a lot of them are staying unhappily. A 1.9% quits rate with 51% of workers watching the market means the resumes are already written; they're just waiting for confidence. When it returns, the churn will look sudden. It won't be.
If you're in that watching 51%, the preparation costs nothing: in our User Success Study of 914 hired users, 79% had an offer within three months of rebuilding their resume with our free resume builder, and 71% never paid.
Does Remote or Hybrid Work Make People More Satisfied?
The honest answer is a paradox, and one randomized trial cuts through it.
- Fully remote workers are the most engaged (31% vs 23% hybrid and 19-23% on-site) but among the least thriving: 36% thriving versus 42% for hybrid workers (Gallup).
- Remote workers also carry more stress (45% daily stress vs 38-39% on-site) and more wanderlust: 57% are watching for or seeking new jobs (Gallup).
- Hybrid is the stable US default: 51% of remote-capable employees work hybrid, averaging 2.3 office days a week, a share that has barely moved in a year. The exception is the federal government, where hybrid crashed from 61% to 28% (Gallup, n=17,660).
- Trust has caught up with practice: 54% of managers trust remote productivity, and 57% of employees feel trusted (Gallup).
- The causal anchor: in a six-month randomized controlled trial of 1,612 employees, hybrid work (two home days a week) raised job satisfaction and cut quit rates by one-third, with no measurable cost to performance or promotions over two years. The 395 managers in the trial started out predicting a productivity loss and ended up perceiving a gain (Bloom, Han & Liang, Nature, 2024).
- Flexibility has a price tag elsewhere: Glassdoor career-opportunity ratings from remote and hybrid workers fell from 4.1 in 2020 to 3.5 in 2025, dropping below on-site workers on advancement satisfaction (Glassdoor Economic Research).
Does Satisfaction Pay Off for Employers?
- Business units in the top engagement quartile outperform the bottom quartile by 23% on profitability, 18% on sales productivity, and 10% on customer loyalty (Gallup's Q12 meta-analysis of 3.35 million employees, 2024).
- The same analysis finds 78% lower absenteeism, 70% higher employee wellbeing, and turnover 21-51% lower depending on the industry's baseline churn.
- The inverse also holds: every burned-out employee is a flight risk at 3x the base rate (SHRM), and every disengaged one is part of Gallup's $10 trillion problem. Employee turnover is where dissatisfaction gets its invoice.
Methodology
The first-party statistics in this article come from our AI Workplace Audit: 1,000 US full-time workers, surveyed February 2026 via Pollfish, census-balanced. AI-behavior questions were asked of the 858 AI users in the sample.
Our samples are US-based. External statistics cover the geographies named inline (Gallup's global figures span 140+ countries; The Conference Board, Pew, BLS, SHRM, APA, and Glassdoor figures are US). Every external statistic was verified against the primary source listed below.
Sources
First-party data: Novoresume AI Workday Study (1,000 US full-time workers, February 2026); Novoresume User Success Study (914 users, May 2026). Methodology above.
External sources, cited inline:
Sources
- The Conference Board, Job Satisfaction 2026 (released June 2026) and Job Satisfaction 2025 editions (annual survey series since 1987)
- Gallup, State of the Global Workplace 2026 (141,444 employed respondents, 140+ countries); US engagement update (43,262 employed US adults), July 2026; worker thriving and job-market survey (22,368 US workers), November 2025; Remote Work Paradox analysis, May 2025; hybrid work update (17,660 US workers), September 2025; Q12 Meta-Analysis 11th edition (3.35M employees), May 2024
- Pew Research Center, How Americans View Their Jobs (5,273 employed US adults), December 2024; blue-collar workers analysis, March 2025
- Randstad, Workmonitor 2026 (27,062 workers, 35 markets), January 2026
- Deloitte, Global Gen Z and Millennial Survey, 2025 (23,482 respondents) and 2026 (22,595 respondents) editions
- SHRM, Employee Mental Health Research Series (1,405 US employees), April 2024
- American Psychological Association, 2025 Work in America survey (2,017 employed US adults), May 2025
- Glassdoor Economic Research, Employee Confidence Index, April 2026; Worklife Trends 2026, November 2025
- Microsoft, Work Trend Index special report: Breaking Down the Infinite Workday (Microsoft 365 telemetry), June 2025
- Bloom, Han & Liang, Nature: hybrid working RCT (1,612 employees), June 2024
- US Bureau of Labor Statistics, Job Openings and Labor Turnover Survey, May 2026
 Add Novorésumé as a preferred source on Google
Get more resume writing tips, career insights, and job search advice in your personalized Google search results.
Related posts

Personal Development
Looking to take your career to the next level? We’ve compiled all the best career tips from industry experts as well as examples you'll need to help you!

Personal Development
Worried that AI will take your job? Discover the latest stats and tips to future-proof your career!

Personal Development
Learn about the common causes and signs of stress in the workplace and find out how to reduce it and improve your well-being.