Updated on February 24, 2026
116 Important HR Statistics and Trends for 2026
Are you looking to understand what HR professionals are doing in 2026? Here are the 116 most important HR statistics you need to consider.


Novorésumé got people hired at
The human resources (HR) landscape is shifting fast. New technologies, changing workforce demographics, and rising expectations around flexibility are reshaping how organizations attract, retain, and support their talent.
For HR professionals, that means navigating an increasingly complex set of challenges, ranging from engagement and burnout to DEI, skills development, and the ongoing tug-of-war over remote work.
Staying ahead requires understanding where things stand.
That's why we've compiled this comprehensive list of 116 HR statistics and trends to look out for in 2026. We’ve covered everything from recruitment and retention to wellness, training, and hybrid work to help you stay attuned and succeed.
Let’s dive in!
Getting started on your resume? Use our professional resume builder to create it in minutes!
Choose a resume template to get started.
12 Key HR Statistics
HR plays a vital role in every organization's success, from attracting the right talent to building cultures where people want to stay.
But the landscape is shifting, and managing employee relations is becoming more difficult. Engagement is declining, managers are under pressure, and employee expectations have fundamentally changed.
Let’s take a look at some statistics that show where HR stands today and where attention is needed most:
- Global employee engagement fell to 21%, matching the lowest levels since the 2020 pandemic.
- This cost the world economy $438 billion in lost productivity.
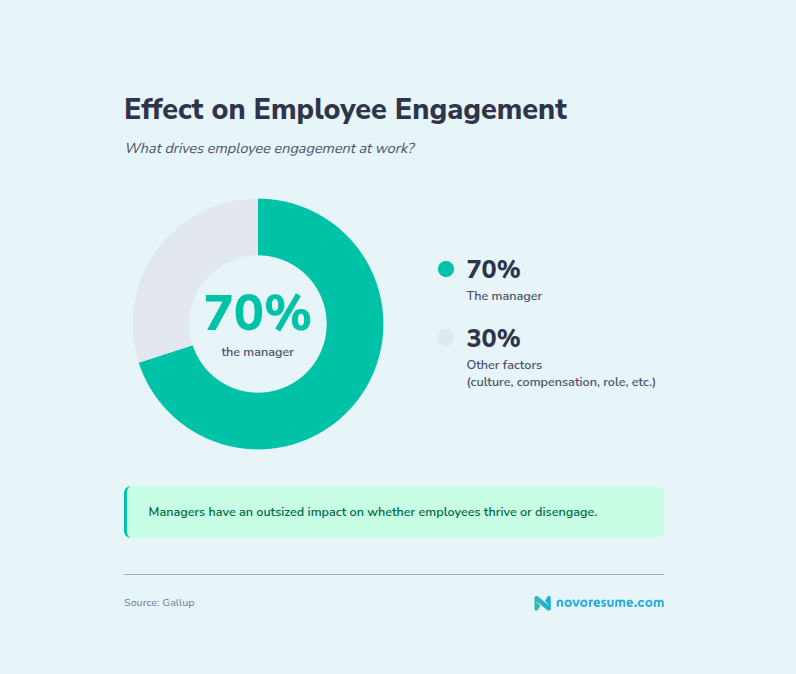
- Up to 70% of team engagement is directly attributable to the manager, making them an outsized influence on workplace culture.
- However, manager engagement fell to 27% in 2024, with young and female managers seeing the steepest declines.
- Half of the global workforce is either watching for or actively seeking a new job.
- Meanwhile in the US, flexibility is also no longer a perk but a serious retention tool – 76% of workers say that flexibility in when and where they work influences their decision to stay with an employer.
- So, what happens if flexibility disappears? Up to 40% of workers say they would start job hunting, and 5% would quit outright.
- Hiring is still slow and expensive. The average cost to hire a new employee is $4,683, with an average time-to-fill of 44 days.
- Recruitment challenges persist across industries, with nearly 70% of organizations still struggling to fill full-time positions.
- Burnout is now widespread, with 52% of employees reporting feeling burned out in 2024.
- There’s also a notable gender gap – 59% of women versus 46% of men are experiencing burnout.
- Employers looking to boost engagement should look towards workers’ sense of purpose. Employees with a strong sense of purpose at work are 5.6 times more likely to be engaged in their jobs.
14 General HR Statistics
The HR function itself is evolving rapidly. AI is reshaping recruitment and performance management, yet most organizations still view workforce planning as short-term. All the while, a new generation is bringing different expectations to the table.
Here's what the data tells us about where HR is heading:
- Employment of HR specialists in the US is projected to grow 8% from 2023 to 2033, faster than the average for all occupations.
- 45% of companies now use AI for human resources management.
- An additional 39% are planning to adopt it in the near future.
- While AI is primarily used in recruiting (43%), it also has other uses in HR.
- 25% of HR professionals use it for learning and development.
- But only 10% of HRs use it for performance management.
- According to data from the US and Europe, only 12% of HR leaders report conducting strategic workforce planning with a focus of at least three years.
- The same study found that offer acceptance rates in Europe are just 56%, indicating that candidates are hesitant.
- A full 18% of new hires leave the job during their probationary period.
- More than one in four employees report receiving no feedback from their employer in the past year.
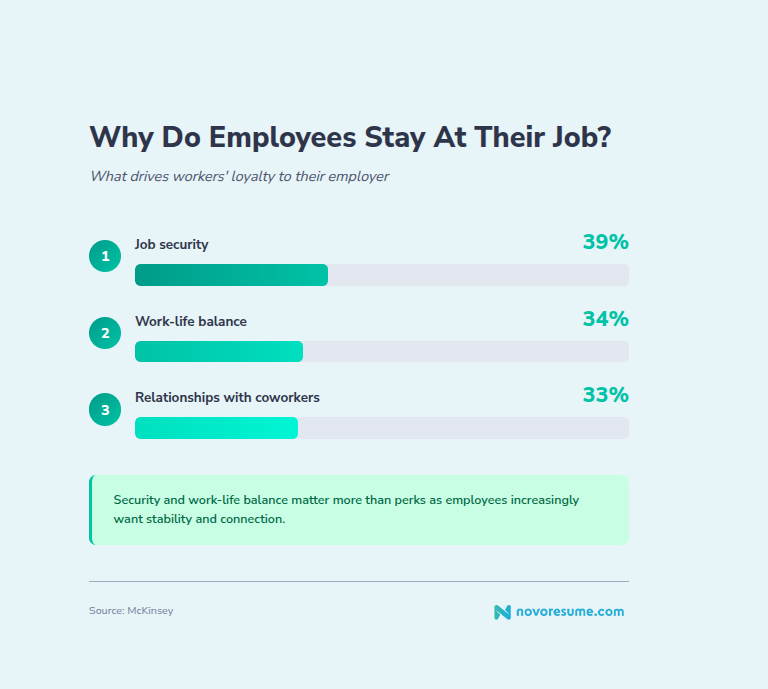
- Right now, job security is the top global reason employees stay with their employer, with 39% citing it as their main concern.
- This is followed closely by work-life balance (34%) and relationships with coworkers (33%).
- By 2030, 30% of the global workforce will be Gen Z.
- Surveys in the US found that 73% of Gen Z workers prefer companies that prioritize diversity, equity, and inclusion.
12 HR and Recruitment Statistics
Finding and hiring talent is one of the most persistent challenges in HR. Candidate expectations have shifted, talent competition is fierce, and flexibility has become a deciding factor for many job seekers.
Here's what the latest recruitment statistics reveal about attracting and hiring talent:
- Too few applicants, competition from other employers, and candidate "ghosting" are the top challenges leaving critical roles vacant.
- In Europe, overall hiring success is at just 46%.
- Across the Atlantic, in the US, organizations with flexible work arrangements report less trouble recruiting than those without – 22% vs 29%, respectively.
- The top reason US employees are seeking new jobs is better pay, with 49% citing it as a priority.
- But the second most important reason, at 48%, is improved work-life balance.
- Flexibility is especially important, with 31% of professionals saying it’s what they're looking for when switching jobs.
- And 38% of workers who aren't job hunting say they're staying because of the flexibility they currently have.
- Stronger career growth opportunities are also important, coming in as the third most cited reason (44%) for switching jobs.
- Considering the average cost of employee turnover for US businesses is $36,295 per departure, employers should take note.
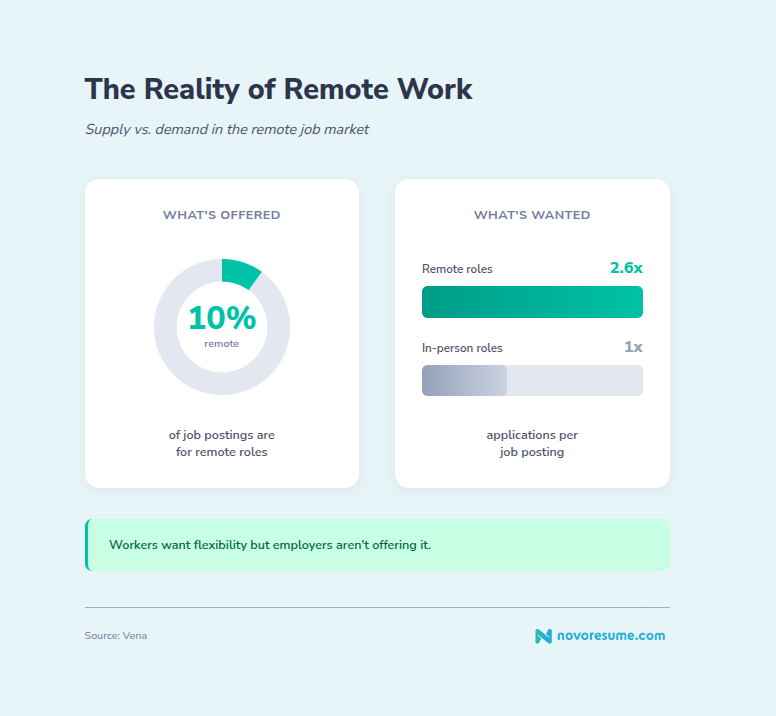
- Remote job postings consistently attract 2.6 times as many applications as in-person roles, despite making up only about 10% of all listings.
- Employee referral programs remain the most effective recruitment strategy for 7 in 10 employers.
- Over 56% of candidates worldwide report applying for jobs outside their current area of expertise, indicating that nonlinear career paths are becoming the norm.
14 Employee Retention and Engagement Statistics
Attracting talent is only half the challenge. Keeping employees engaged and committed is what builds long-term success.
However, engagement levels are at historic lows, and the factors driving people to stay or leave have shifted significantly.
Here's what the data says about retention and engagement today:
- Approximately one in five employees globally is engaged at work.
- Half of engaged employees describe themselves as thriving, compared to only one-third of those who aren’t engaged.
- In the US, only 31% of American workers report feeling engaged – that’s the lowest figure since 2014.
- 25% of workers currently hold a second job, and 37% are considering finding one.
- Disengaged employees are up to six times more likely to actively seek a new job.
- Meanwhile, 45% of employees would stay at a company due to career advancement opportunities.
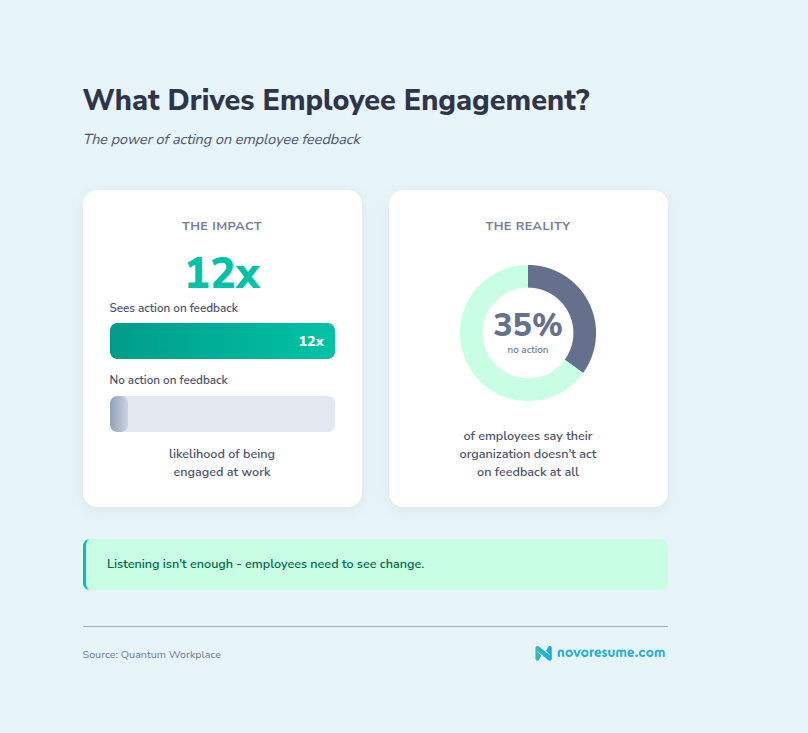
- Employees who see their organization act on feedback are 12 times more likely to be engaged.
- Yet 35% of employees say their organization doesn't do that at all.
- Employees experiencing burnout are three times more likely to be actively searching for a new job.
- Gen Z workers are more likely to experience disengagement than older generations, citing a lack of recognition, limited resources, and fewer opportunities to upskill.
- When managers receive both role-specific training and consistent support, their reported well-being jumps from 28% to 50%.
- Companies with engaged employees are 23% more profitable than those with low engagement.
- If every organization reached best-practice engagement levels (around 70%), the world economy could grow by an additional $9.6 trillion.
- That would be a 9% boost in global GDP.
16 Statistics About Diversity and Inclusion
Diversity can be both a business advantage and a moral imperative. Companies with diverse leadership consistently outperform their peers, and job seekers increasingly expect inclusive workplaces.
Yet inclusion isn’t universal, particularly at the top of the corporate ladder. Here’s what the numbers reveal:
- 65% of US companies are maintaining their DEI (diversity, equity, and inclusion) budgets in 2025, while 22% are increasing them.
- Companies with the greatest racial and ethnic diversity at the leadership level are 36% more profitable than those with the least, according to global data.
- Organizations with diverse leadership also generate 19% more innovation-driven revenue.
- In the US, up to 76% of job seekers consider workplace diversity an important factor when evaluating job offers.
- In fact, nearly one-third of candidates would not apply to a company that lacks diversity.
- 67% of workers aged 18-34 would consider declining a job or leaving a company if there were a gender imbalance in leadership.
- In 2024, female business ownership jumped by 41%.
- However, as of that same year, only 10.4% of Fortune 500 CEOs were women.
- Only eight Fortune 500 companies have Black CEOs.
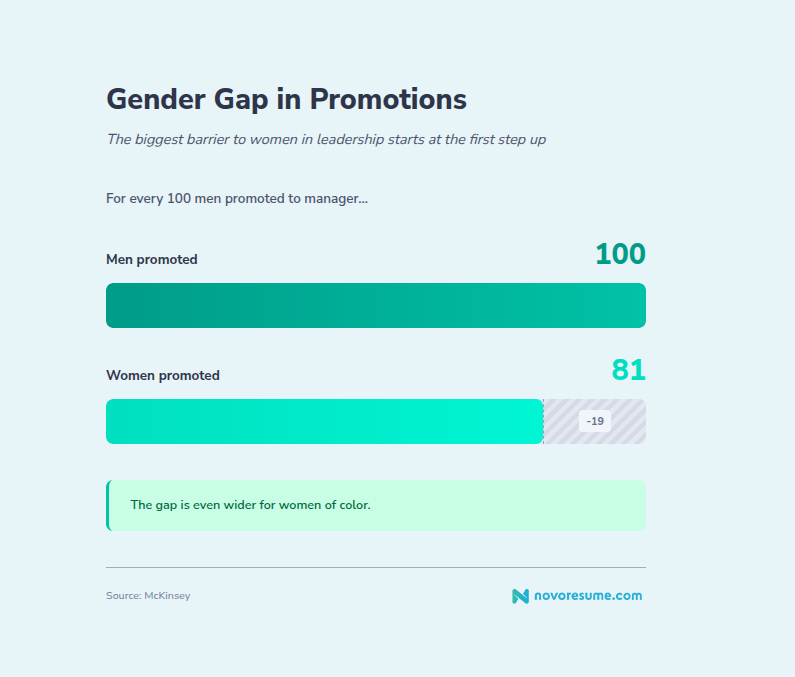
- For every 100 men promoted to managerial roles, only 81 women are promoted.
- And that gap is even wider for women of color.
- Education can make a huge difference, too. Individuals with a bachelor's degree earn $1.2 million more over their lifetime than those with only a high school diploma.
- But not everyone is on the job market. The overall US unemployment rate stands at 3.9%.
- However, that breaks down to 5.6% unemployment for Black workers and 5.0% for Hispanic workers.
- Meanwhile, the unemployment rate for White and Asian workers is at 3.4%.
- People with disabilities face a 7.2% unemployment rate and are less likely to be employed across all age groups.
15 Employee Burnout and Wellness Statistics
Burnout in the workplace is a systemic challenge. Employees experience burnout due to stressful environments, heavy workloads, understaffing, and insufficient managerial support. The effects all extend to both negative health outcomes and the bottom line.
These statistics can help you understand the scope of burnout and focus on the importance of employee wellness:
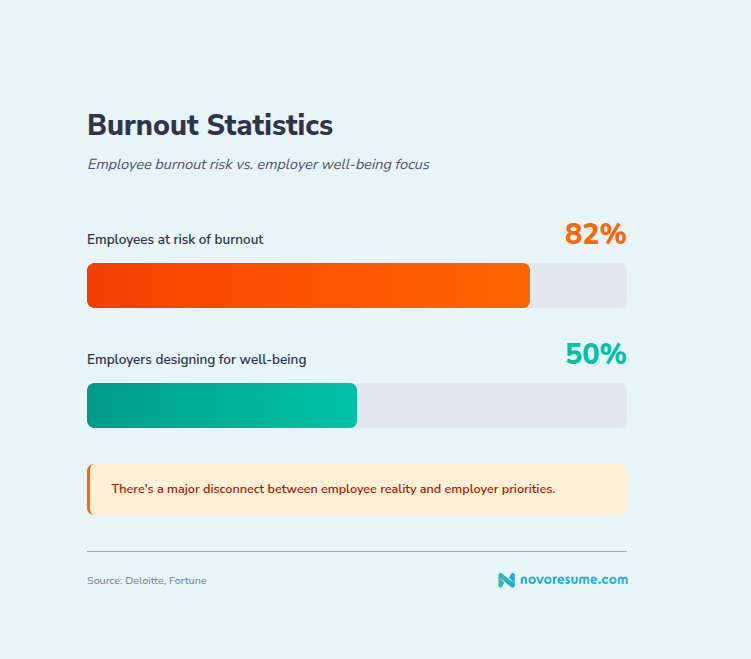
- 82% of employees were at risk of burnout over the last year, but only half of employers plan work with well-being in mind.
- 76% of HR leaders plan to overhaul performance management processes after identifying leadership gaps as a root cause of burnout.
- The top cited causes of burnout are workload (51%), staff shortages (42%), and juggling personal and professional life (41%).
- Women experience a 13% higher rate of burnout than men.
- Mid-level employees report the highest burnout rates at 54%, caught between senior leadership demands and frontline pressure.
- Burned-out employees are 63% more likely to take a sick day.
- More concerningly, they are 23% more likely to visit the emergency room.
- Employee burnout costs employers an average of $3,999 per employee per year in lost productivity and health-related costs.
- Over 40% of workers cite understaffing as the most stressful part of their job.
- The second-highest factor is 34% – poor communication.
- But reducing working hours doesn't prevent burnout; managers do. Workers who feel supported by their managers are better insulated from burnout even in high-pressure situations.
- Employees who feel their work "makes a positive difference" are 12 percentage points less likely to report stress.
- Toxic workplace behavior is the single biggest predictor of burnout.
- 92% of employees say mental health care coverage is important for creating a positive workplace culture.
- Yet 31% of US workers report feeling 'often or always' stressed at work.
18 Remote and Hybrid Working Trends
The 2020s began with remote and hybrid work expanding. Now, return-to-office mandates from major employers are reshaping the job market.
That said, employee demand for flexibility remains strong.
There’s a growing mismatch between what employees want and what employers offer. Here's what the latest data reveals:
- 51% of remote-capable employees in the US work in a hybrid arrangement.
- Only 28% work fully remote, and 21% work fully on-site.
- 70% of remote-capable employees prefer a hybrid work arrangement.
- However, there's a significant supply gap – only 13% of US job postings offer hybrid or remote options.
- Hybrid workers report the highest engagement rates at 35%.
- Fully remote workers are at 33%, and in-office workers are at 27%.
- Hybrid work models can reduce employee turnover by 12% and workspace needs by 40%.
- Companies save an estimated $11,000 per year for each employee working at least half-time.
- Hybrid workers experience burnout symptoms 15% less frequently than in-office workers.
- 79% of remote professionals report lower stress.
- 82% of remote workers say their mental health is better with flexible work arrangements.
- Remote workers save an average of 72 minutes per day in commute time, with research showing much of this is reinvested into work.
- 61% of remote employees report being more productive working from home.
- 70% of job seekers rank hybrid work as a preferred option when evaluating opportunities.
- Only 1.8% of current remote workers would prefer fully in-office work.
- Of all remote-capable employees, 60% prefer a hybrid setup, 30% want fully remote, and less than 10% prefer entirely on-site.
- Despite employee demand, in-office job postings have increased by 21% since 2023, and there are widespread return-to-office mandates worldwide.
- Employees whose work environment aligns with their preference (remote, hybrid, or in-office) are 15% less likely to experience burnout and report higher overall well-being.
15 Onboarding and Training Statistics
The onboarding process is vital to help new hires understand their roles and build commitment. Meanwhile, continuous training helps employees develop skills, boost performance, and stay engaged in an era of rapid change.
Here are some important onboarding and training statistics that can help you improve your approach:
- Only 12% of employees strongly agree their organization does a great job of onboarding new hires.
- Organizations with a strong onboarding process improve new hire retention by 82% and boost productivity by over 70%.
- When managers are actively involved in onboarding, new hires are 3.4 times more likely to describe their experience as exceptional.
- 56% of new hires became more productive after just one meeting with an onboarding buddy.
- That figure jumps to 97% with eight or more buddy interactions in the first 90 days.
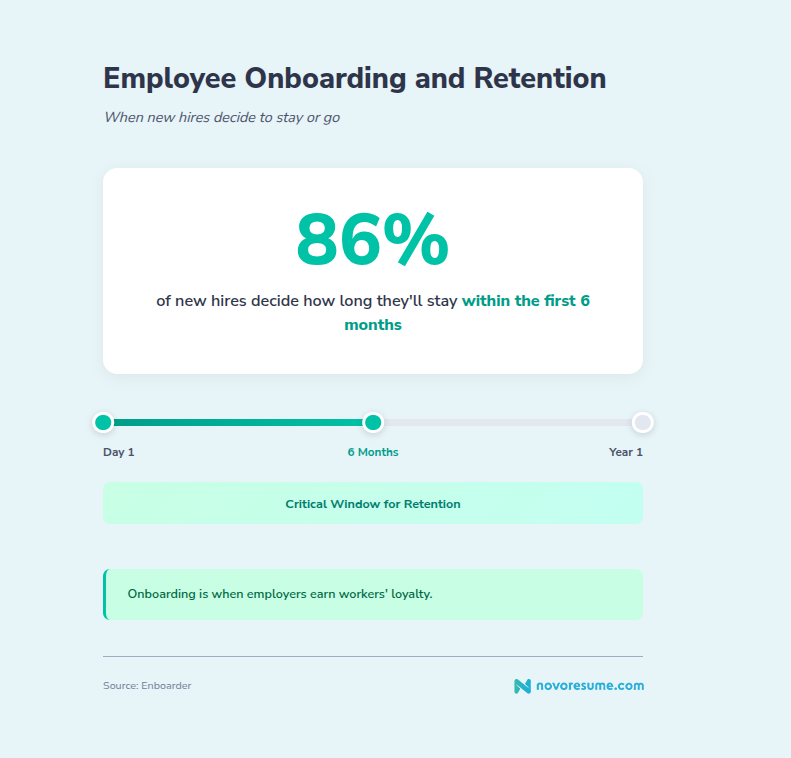
- 86% of new hires decide how long they will stay with a company within the first six months.
- 90% of organizations say providing learning opportunities is their number one retention strategy.
- 94% of employees say they would stay at a company longer if it invested in their learning and development.
- 71% of employees want to update their skills more frequently.
- And 80% want their company to invest more in upskilling.
- 55% of organizations are already providing AI skills training.
- Of those, 64% plan to increase their investment.
- And it makes sense, since 80% of employees report using AI in the workplace.
- That number is up from 72% of employees in 2024.
- Engagement and retention rates are 30-50% higher in organizations with a strong learning culture.
Conclusion
That concludes this comprehensive list of the most important HR statistics and trends you need to know in 2026.
We hope these 116 statistics help you identify the most critical areas to improve your work environment and achieve greater success.
For more advice, check out the rest of our career blog!
Sources
- ADP - People at Work 2025: A Global Workforce View - https://www.adp.com/resources/articles-and-insights/articles/p/people-at-work-2025.aspx
- AIHR (Academy to Innovate HR) - HR Trends Report 2025 (PDF) - https://www.aihr.com/resources/AIHR_HR_Trends_Report_2025.pdf
- American Journal of Preventive Medicine - "The Health and Economic Burden of Employee Burnout" (2025) - https://www.ajpmonline.org/article/S0749-3797(25)00023-6/abstract
- American Psychological Association - Work in America 2024 Report - https://www.apa.org/pubs/reports/work-in-america/2024/topline-data.pdf
- APLU (Association of Public and Land-grant Universities) - "How Does a College Degree Improve Graduates' Employment and Earnings Potential?" - https://www.aplu.org/our-work/4-policy-and-advocacy/publicuvalues/employment-earnings/
- BCG (Boston Consulting Group) - "How Diverse Leadership Teams Boost Innovation" (2018) - https://www.bcg.com/publications/2018/how-diverse-leadership-teams-boost-innovation
- Brandon Hall Group - "The True Cost of a Bad Hire" / Onboarding Research - https://brandonhall.com/
- Bureau of Labor Statistics - Employment Projections and Labor Force Statistics (ongoing) - https://www.bls.gov
- Center for American Progress - Disability Employment Statistics - https://www.americanprogress.org/
- Cisco - Global Hybrid Work Study 2025 - https://newsroom.cisco.com/c/r/newsroom/en/us/a/y2025/m06/hybrid-work-2025-how-leaders-can-get-it-right.html
- Deloitte - Various Workforce and Burnout Surveys (2024-2025) - https://www2.deloitte.com/
- Eagle Hill Consulting - 2024 Employee Burnout Survey - https://www.eaglehillconsulting.com/
- Enboarder - The State of the New Hire Experience 2025 - https://enboarder.com/
- Engagedly - "Top DEI Statistics You Need to Know" (2025) - https://engagedly.com/blog/top-dei-statistics-you-need-to-know/
- Federal Reserve Bank of Minneapolis - "A Lifetime of Earnings: Comparing High School and College Graduates" - https://www.minneapolisfed.org/
- Fortune - Fortune 500 CEO Demographics (2024) - https://fortune.com/ranking/fortune500/
- Gallup - State of the Global Workplace Report 2025 - https://www.gallup.com/workplace/349484/state-of-the-global-workplace.aspx
- Gallup - "Purposeful Work Boosts Engagement" (November 2025) - https://news.gallup.com/poll/697403/purposeful-work-boosts-engagement-few-experience.aspx
- Glassdoor - Diversity & Inclusion Workplace Survey - https://www.glassdoor.com/research/
- Global Workplace Analytics - Latest Work-at-Home/Telecommuting Statistics - https://globalworkplaceanalytics.com/
- Grant Thornton - 2024 State of Work in America Survey - https://www.grantthornton.com/insights/survey-reports/advisory/2024/burnout-turning-up-the-heat-on-us-companies
- High5 Test - Burnout and Job Search Correlation Study (2025) - https://high5test.com/
- IE Center for Health and Well-Being - Remote Work and Burnout Research - https://www.ie.edu/university/about/ie-schools/school-politics-economics-global-affairs/center-for-health-and-well-being/
- JobLeads - US Job Market Report 2026 - https://www.jobleads.com/
- LinkedIn - Workplace Learning Report 2024 - https://learning.linkedin.com/resources/workplace-learning-report
- LinkedIn - Workplace Learning Report 2025 - https://learning.linkedin.com/resources/workplace-learning-report
- McKinsey & Company - HR Monitor 2025 - https://www.mckinsey.com/capabilities/people-and-organizational-performance/our-insights/hr-monitor-2025
- McKinsey & Company - Diversity Wins: How Inclusion Matters (2020) - https://www.mckinsey.com/featured-insights/diversity-and-inclusion/diversity-wins-how-inclusion-matters
- McKinsey & Company - Women in the Workplace 2024 - https://www.mckinsey.com/featured-insights/diversity-and-inclusion/women-in-the-workplace
- MentorCliq - "80+ Diversity in the Workplace Statistics" (2025) - https://www.mentorcliq.com/blog/diversity-in-the-workplace-statistics
- Microsoft - The New Future of Work Research - https://www.microsoft.com/en-us/research/project/the-new-future-of-work/
- NAMI (National Alliance on Mental Illness) - 2024 Workplace Mental Health Poll - https://www.nami.org/support-education/publications-reports/survey-reports/the-2024-nami-workplace-mental-health-poll/
- OfficeRnD - Hybrid Work Statistics and Research - https://www.officernd.com/
- Owl Labs - State of Hybrid Work 2025 (US Report) - https://owllabs.com/state-of-hybrid-work/2025
- Paychex - "The Average Cost To Hire a New Employee in 2025" - https://www.paychex.com/articles/human-resources/cost-of-hiring-an-employee
- Pew Research Center - Various Workforce Demographic Studies - https://www.pewresearch.org
- Quantum Workplace - 2025 Workplace & HR Trends Report - https://www.quantumworkplace.com/2025-workplace-trends-report
- Ragan Communications - Gen Z Workplace Engagement Research (2025) - https://www.ragan.com/
- Resume.org - "1 in 8 Companies Are Scaling Back DEI Commitments in 2025" (January 2025)
- Robert Half - Demand for Skilled Talent Report / Remote Work Statistics Q3 2025 - https://www.roberthalf.com/us/en/insights/research/remote-work-statistics
- SHRM (Society for Human Resource Management) - 2025 Talent Trends Report - https://www.shrm.org/topics-tools/research/2025-talent-trends
- SHRM - "7 Trends That Will Shape HR in 2025" - https://www.shrm.org/topics-tools/news/hr-quarterly/7-trends-that-will-shape-hr-in-2025
- SHRM - 2024 Talent Acquisition Benchmarking Report - https://www.shrm.org/
- TalentLMS - 2024 Employee Upskilling and Reskilling Report - https://www.talentlms.com/
- US Census Bureau - Population and Workforce Projections - https://www.census.gov
- Vena Solutions - True Cost of Employee Turnover Report (2025) - https://www.venasolutions.com/
- Wellhub (formerly Gympass) - State of Work-Life Wellness 2025 - https://wellhub.com/en-us/blog/wellness-and-benefits-programs/burnout/
- Women Business Collaborative - 2024 Women CEOs in America Report - https://www.wbcollaborative.org/women-ceo-report/
- Workday - "HR Trends to Watch in 2025" - https://www.workday.com/en-us/perspectives/human-resources/2025/02/hr-trends-to-watch-in-2025-building-the-human-centric-workplace.html
- World Economic Forum - Future of Jobs Report (ongoing) - https://www.weforum.org/publications/the-future-of-jobs-report-2025/
Related posts

Job Interviews & Find A Job
Discover the best US cities for digital nomads in 2026, with Las Vegas ranking #1 for affordability, sunshine, airport access and remote-work essentials.

Job Interviews & Find A Job
Want an online job but don't know where to start? Check out our article for a list of the best online jobs, top job boards, and tips on how to apply!

Job Interviews & Find A Job
Get ready for your job hunt with these 19 reasons for leaving a job and a guide on how to talk about it during job interviews.