Updated on February 24, 2026
127 Remote Work Statistics You Need to Know in 2026
Check out the 127 newest remote work statistics to get a comprehensive idea about the pros, cons, and the future of remote work.


Novorésumé got people hired at
Remote work has been on the rise for the past decade. Between technological developments and health needs, it has become a permanent fixture of the modern workplace.
However, it’s now evolved into a tug-of-war between employees who want flexibility and employers who push return-to-office mandates.
Despite high-profile return-to-office mandates making headlines, remote work is still deeply embedded in how many people work today. Employees who value the flexibility, work-life balance, and productivity they gain from working from home are not willing to give it up.
So, where does remote work actually stand in 2026? We've compiled the 127 most important remote work statistics to give you the full picture.
Let’s get started!
Getting started on your resume? Use our professional resume builder to create it in minutes!
Choose a resume template to get started.
12 Key Remote Work Statistics
Before we dive into the specifics, let’s look at the headline statistics that define remote work today.
The numbers might paint a different picture than you expect:
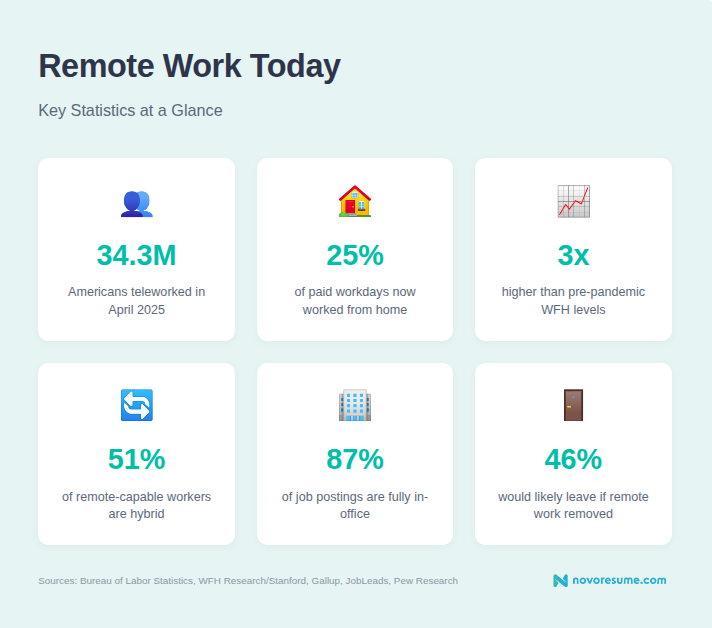
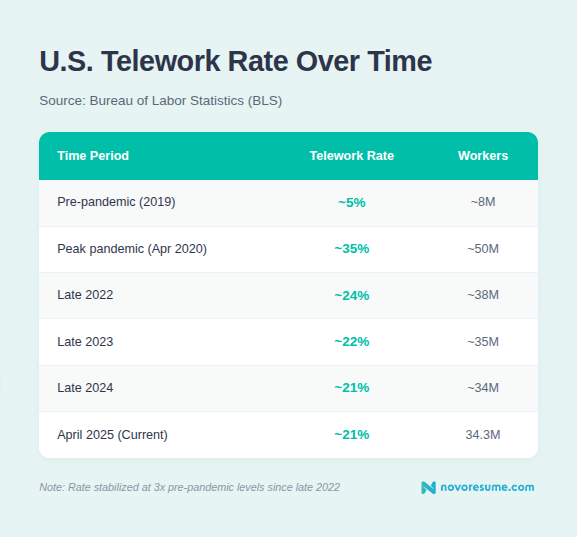
- Approximately 34.3 million Americans worked from home or remotely for pay in April 2025.
- In the US, the telework (remote work) rate has remained stable since late 2022, between 18% and 24%.
- About 25% of all paid workdays are now worked from home.
- That’s more than three times the rate before March 2020.
- The vast majority of open job roles in the US are fully in-office (87%).
- The listings are 7% for hybrid roles, and only 6% are fully remote.
- Globally, workers spend an average of 1.27 days per week working from home.
- Remote work rates vary significantly by country. Workers in Canada, the UK, and Australia work from home an average of nearly 2 days per week, while those in South Korea and Japan work from home an average of around half a day.
- 75% of employed American adults in jobs that can be done from home are working at least some of the time.
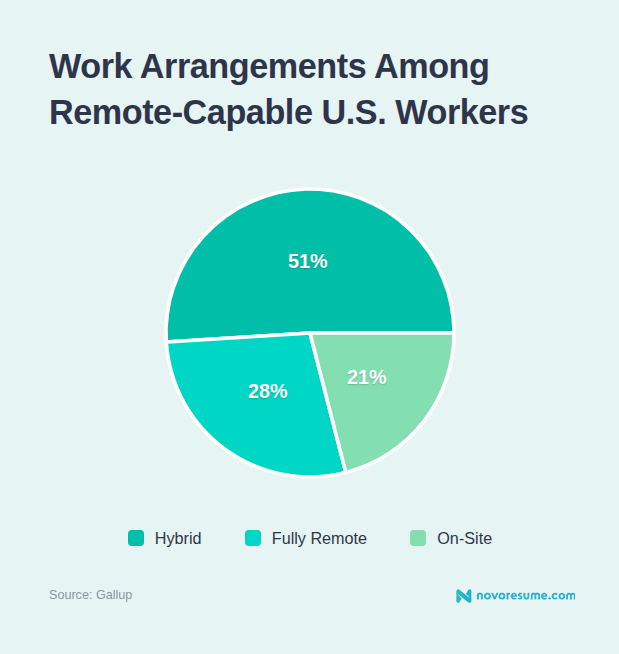
- Among remote-capable US employees, 51% are hybrid, 28% of them are fully remote, and 21% are fully on-site.
- 88% of US employers provide some hybrid work options, though this varies by seniority level and individual circumstances.
- Only 25% of employers currently offer hybrid work to all their employees.
13 Return-to-Office Statistics
Return-to-office mandates have been dominating headlines over the past year. From tech giants to federal government agencies, employers have been calling workers back to their desks.
But how widespread is the push, and how much has it actually changed where people work? Let’s see what the data shows:
- In-office job advertisements in the US are at 87%.
- That’s a 21% increase since 2023, when about 66% of job postings were on-site.
- Only 12% of executives with hybrid or fully remote workforces plan to issue a return-to-office mandate in the year ahead.
- Planned shifts back to on-site work in the coming year would reduce work-from-home days by less than half a percentage point – from 21.2% to 20.8%.
- 53% of workers report that they or someone they know was required to return to the office in the past year.
- That’s a sharp increase from only 23% in 2024.
- Still, 73% of workers say their companies have not changed their remote or hybrid policies in the past year.
- However, hybrid work among federal government employees fell from 61% in late 2024 to only 28% in mid-2025 following stricter mandates.
- So, 46% of US federal workers are now fully on-site.
- That’s more than double the national average of 21%.
- In the tech sector, remote work remains strong: 47% of remote-capable employees are fully remote.
- Another 45% of tech workers are hybrid.
- Only 9% remain fully on-site.
14 Hybrid Work Statistics
Hybrid work emerged as the leading model for remote-capable employees.
Neither fully remote nor fully on-site, it's the compromise that most employers and workers have settled on. But what does hybrid actually look like in practice?
Let’s look at the stats:
- Just over half of remote-capable US employees currently work a hybrid schedule.
- Hybrid workers now spend 46% of their workweek in the office.
- That’s equivalent to 2.3 days per week.
- The numbers are up from 42% in 2022, but all of that increase happened in 2023. Working arrangements for remote-capable employees seem pretty stable.
- Another survey found that most hybrid employees in the US report going into the office 3 days (39%) or 4 days (34%) per week.
- Employee satisfaction peaks when they spend roughly 3 days in the office and 2 at home, which creates an opportunity for better work-life balance.
- But only 6% of job seekers actually say they prefer hybrid arrangements.
- Most prefer either fully remote (23%) or fully on-site (23%).
- However, nearly one in three US job seekers says they are open to any work setting.
- In 2023, more than 70% of US employers offered some form of hybrid work.
- By late 2025, only 7% of newly opened positions are marked as hybrid.
- Consulting leads in hybrid work: 18% of consulting jobs are hybrid.
- That’s almost three times the national average of 7%.
- 69% of managers report that hybrid work has improved their team's performance.
16 Employee Preferences and Retention Statistics
Whether you’re looking for a job or hiring for your organization, you need to understand what workers actually want and how far they’re willing to go to get it.
The data show that flexibility is non-negotiable for many employees, and employers who ignore that at their own risk. Here are the details:
- 81% of workers say remote work is the most important factor in a job.
- Salary ranks second at 77%, followed by flexible scheduling at 72%.
- 65% of candidates say a fully remote job is their ideal arrangement going forward.
- About 34% prefer hybrid, and only 1% say full-time in-office is best for them.
- This statistic aligns with overall findings for remote–capable employees: 60% prefer a hybrid arrangement, while 30% want to be fully remote.
- Less than 10% of all current remote-capable employees prefer full-time on-site work.
- 46% of hybrid and remote workers say they would be unlikely to stay at their job if that option were removed.
- Among fully remote workers, 61% say they would be unlikely to stay if the option to work from home disappeared.
- But 76% of job seekers on FlexJobs say they would look for a new job if remote work were eliminated.
- Owl Labs surveyed the general US workforce and found something different. Only 40% of workers would start job hunting if flexible work were taken away.
- However, 22% of workers would expect a raise to compensate.
- Only 5% would quit outright.
- 64% of recruiters say that being able to pitch a work-from-home policy helps them find high-quality talent.
- 69% of workers say they would even accept a pay cut to work remotely.
- That’s 11% higher than in 2024, underscoring the continued importance of flexibility.
- Workers around the world say they would trade roughly 5% of their salary to keep 2-3 work-from-home days per week.
15 Remote Work by Industry and Occupation Statistics
Remote work isn't distributed evenly across the economy. Some industries have fully embraced flexibility, while others remain firmly tied to the workplace.
Here's how remote work breaks down by sector and job type:
- The industries with the highest remote work rates are finance, information services, and professional and business services.
- In the information industry, which includes IT, remote work is the norm – it has the highest work-from-home rate of any sector.
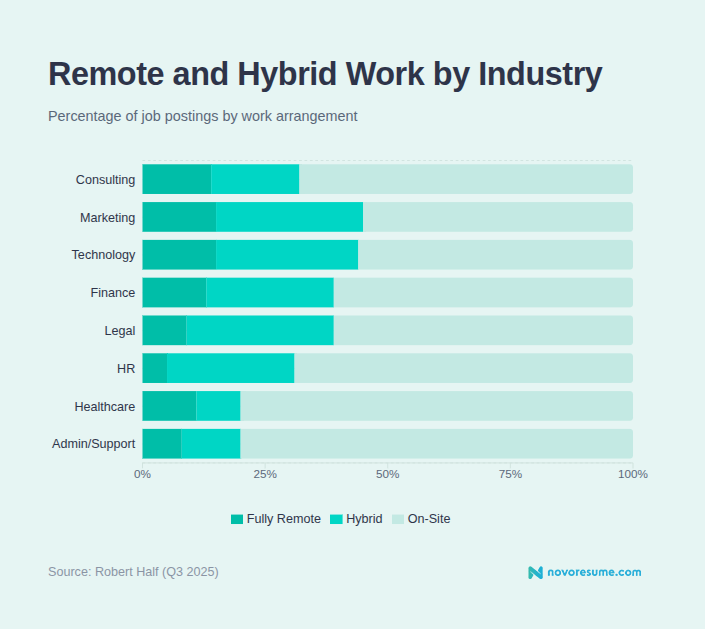
- Consulting is the most flexible field overall, with 18% of consulting jobs being hybrid and 14% fully remote.
- That means nearly one in three consulting roles offers some form of remote work.
- Other white-collar fields with high flexibility include law and marketing. Across finance and IT, roughly 25% of jobs are hybrid or remote.
- Marketing and creative roles show 30% hybrid and 15% fully remote job postings.
- Technology roles show 29% hybrid and 15% fully remote job postings.
- Finance and accounting roles show 26% hybrid and 13% fully remote.
- Legal roles show 30% hybrid but only 9% fully remote.
- HR roles show 26% hybrid and only 5% fully remote.
- At the other end, hands-on industries have very limited remote options. In healthcare, 92% of roles are on-site.
- Even many administrative and customer support roles are 80% fully on-site.
- Construction workers have a telework rate of under 8%.
- Transportation sits slightly higher at 8.8%.
- Food service is the lowest at 4.8%.
15 Remote Work by Demographics Statistics
As with industry, remote work access and preferences also vary significantly by gender, age, education, and income level.
Let’s look at who’s actually working from home and what the data shows:
- Women work remotely at slightly higher rates than men – 21.6% compared to 20.5%.
- Women are also more likely than men to say they would leave their job if remote work were removed – 49% vs 43%.
- Workers under 50 are more likely to say they would leave if remote work were taken away (50%) than older workers (35%).
- That said, Gen Z has the lowest preference for fully remote work at 23%, compared with 35% for Millennials and 35% for Gen X.
- Workers with young children under 8 in the household have a WFH rate 7 percentage points higher than those without young children.
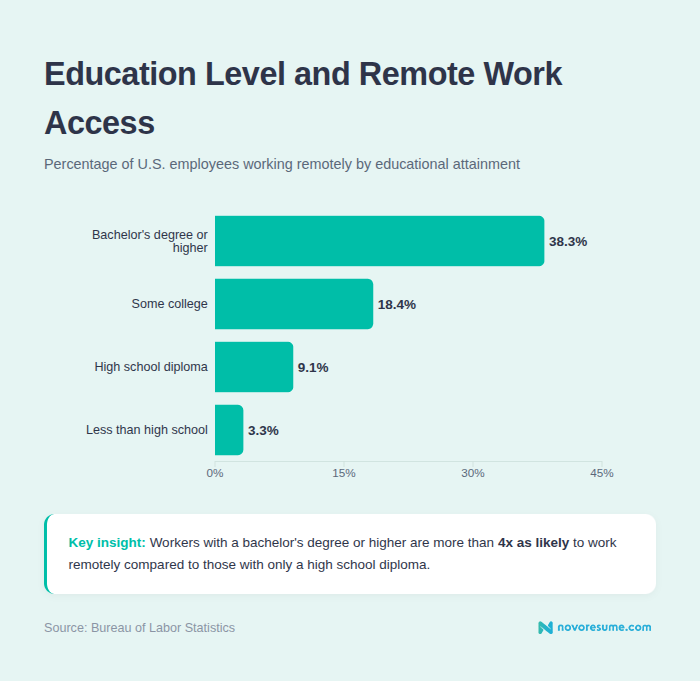
- Education also plays a major role in remote work access: 38.3% of workers with a bachelor's degree or higher work remotely, compared with much lower rates for those without a degree.
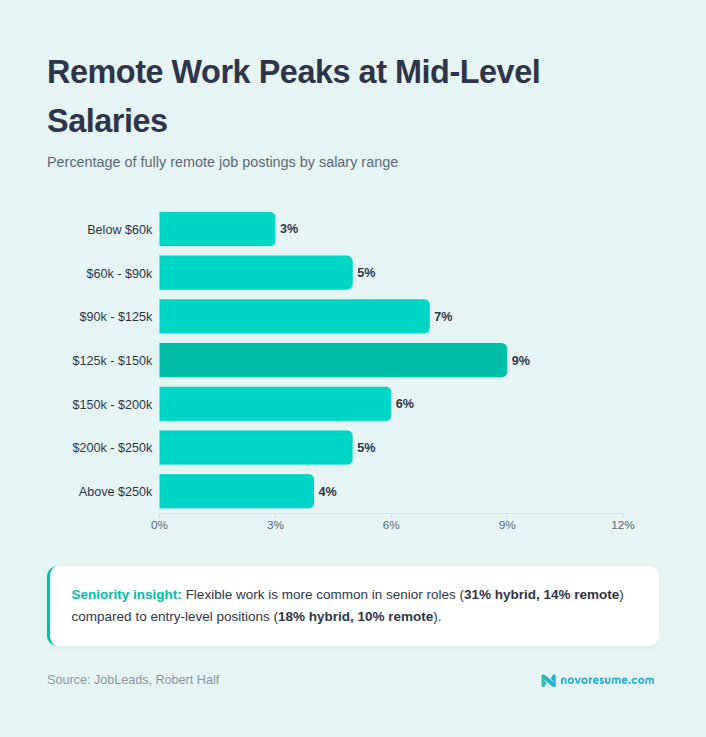
- Remote work appears to be a mid-career privilege, with remote roles peaking at 9% in the $125k-$150k salary band.
- Below $60k annually, only 3% of roles are remote, and 2% are hybrid.
- Above $250k, flexibility drops again – only 4% of roles are remote, and 9% are hybrid. The highest earners are still expected to be in the office.
- However, when looking at seniority rather than salary, flexible work is more common in senior roles. 31% of new senior-level job postings are hybrid, and 14% are fully remote.
- For mid-level roles, that drops to 25% hybrid and 12% remote.
- Entry-level roles offer the least flexibility, with 18% hybrid and 10% remote.
- Asian workers have the highest work-from-home rate at 31.2%.
- White workers follow them at 23.1%, while Black workers sit at 19.8%.
- Hispanic workers have the lowest WFH rate at 11.4%.
14 Remote Productivity and Performance Statistics
One of the most debated aspects of remote work is its impact on employee productivity. Employers worry about distractions and disengagement, while employees insist they get more done without the interruptions of office life.
It's the question that fuels most return-to-office debates. Here's what the research shows:
- 62% of workers report feeling more productive when working from home.
- Meanwhile, 69% of managers say that hybrid work has improved their team's performance.
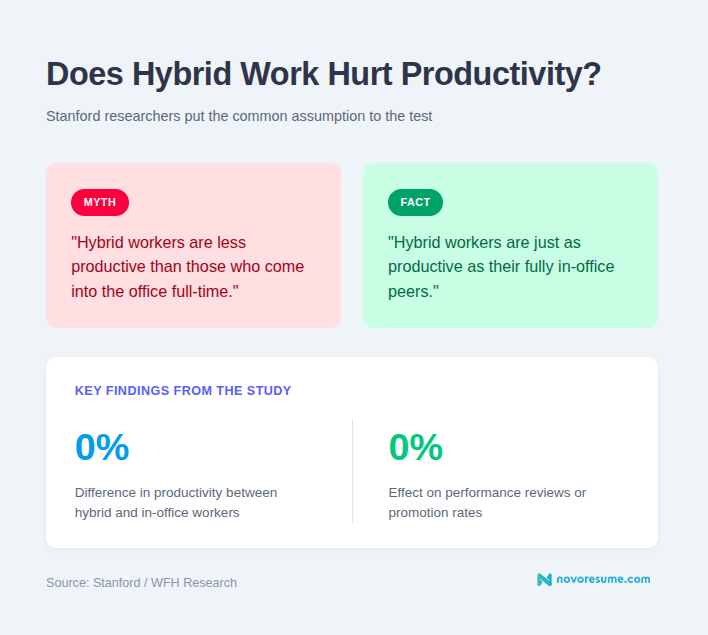
- A major Stanford study found that hybrid workers are just as productive as their fully in-office peers.
- The same study found that hybrid work had zero effect on performance reviews or promotion rates.
- Remote workers report being more creative at home: 51% say they produce better creative output when working remotely.
- 47% of employees report being more productive on-site.
- And 62% highlight the social benefits of in-person collaboration.
- Home workers spend 30 minutes less per day on non-work topics than office workers.
- They also spend 7% less time talking to management.
- 74% of workers say not having a commute makes their day more productive.
- On average, remote workers in the US save about 55 minutes per day by not commuting.
- Globally, that figure rises to 72 minutes saved per day.
- However, 29% of remote workers in the US cite communication gaps as a major challenge affecting their work.
- 38% of managers report that collaboration has become more difficult in a remote setting.
Should You Work Remotely?
By now, you've seen the statistics on the current state of remote work. Now you just have to determine whether that’s the right thing for you or your organization.
Job satisfaction is among the most commonly cited outcomes of remote work, and numerous surveys support this. But the debates around remote vs. in-office productivity, teamwork, and communication are still raging.
Here's a breakdown of the pros and cons to help you decide:
8 Pros of Remote Work
- Better work-life balance. 76% of workers list improved work-life balance as a top benefit of remote and hybrid work.
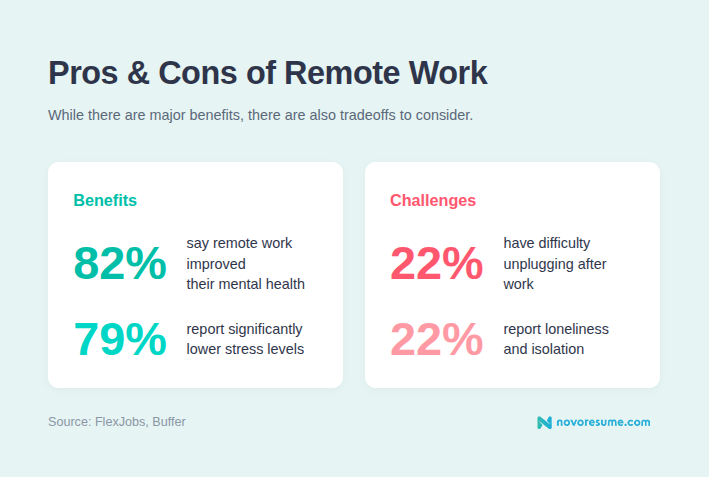
- Improved mental health. 82% of professionals say their mental health is better when working remotely.
- Lower stress levels. 79% of remote workers report lower stress levels than when working on-site.
- Higher job satisfaction. 57% of remote workers report being satisfied with their jobs, compared to 50% of in-office employees.
- Significant time saved. Remote workers save an average of 55 minutes per day by not commuting. Globally, the average is 72 minutes, which helps with time management.
- Financial savings. Remote workers save approximately $6,000 to $12,000 annually in commuting costs, food expenses, and work attire.
- Environmental benefits. A study found that remote workers reduce their carbon footprint by 54% compared to on-site workers.
- More flexibility. 67% of remote workers say flexible scheduling is the top benefit of working from home.
8 Cons of Remote Work
- Difficulty unplugging. The biggest challenge remote workers face is unplugging after work, cited by 22% of respondents. It’s not unusual to find yourself working longer, uninterrupted hours.
- Loneliness. 22% of remote workers cite loneliness as a significant challenge.
- Communication gaps. 29% of remote workers say communication issues are a major challenge affecting their work.
- Teamwork challenges. 38% of managers say collaboration has become more difficult in a remote setting.
- Weaker workplace relationships. 71% of respondents agree that building and maintaining relationships is a challenge for virtual teams.
- Career visibility concerns. Remote employees are 16% less likely to report that their manager involves them in goal setting.
- Home office costs. While remote workers save on commuting, only 23% say their employer covers the cost of a coworking space membership, and many must fund their own home office setup.
- Lower overall well-being for some. Despite higher engagement, fully remote workers are less likely to be thriving overall (36%) than hybrid workers (42%).
12 Future of Remote Work Statistics
It’s normal to wonder where remote work is headed. Despite the return-to-office headlines, the data suggest that flexible work isn't going anywhere.
Here's what workers, employers, and researchers expect in the years ahead:
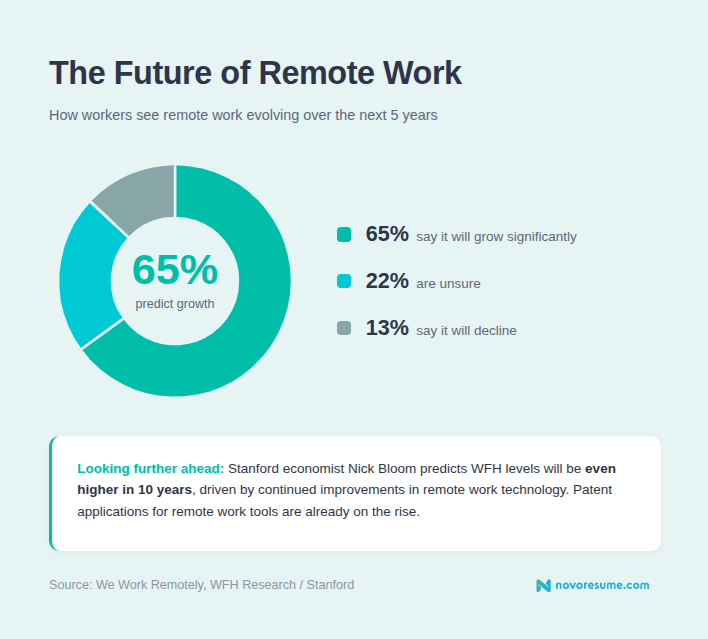
- Nearly 65% of workers worldwide predict that remote work will grow significantly over the next five years.
- Only 13% think it will decline.
- 49% of workers report seeing an increase in remote roles in 2025.
- In the US, 28% of workers expect to work from home permanently within five years.
- That’s an 87% increase from workers’ intentions before 2020.
- Remote work has stabilized at around 25% of paid workdays and is not expected to decline significantly.
- Stanford economist Nick Bloom predicts that WFH levels globally will be even higher in ten years, driven by continued improvements in remote work technology.
- Patent applications for remote work technologies are rising, indicating innovation ahead.
- 75% of business leaders say their company will likely change the nature of its workplace by the end of 2026.
- 27% of workers say they are not confident their current job will exist in five years.
- Some concerns they cite are fewer remote opportunities (17%) and AI displacement (16%).
- 69% of workers have changed or considered changing career fields in the past year, with more remote work options (67%) being the top motivator.
Conclusion
That wraps up our list of 127 remote work statistics for 2026.
Whether you're an employee deciding if remote work is right for you or an employer shaping your workplace policies, we hope these insights help you navigate the evolving world of work.
For more advice, check out the rest of our career blog!
Sources
- Buffer - State of Remote Work - https://buffer.com/state-of-remote-work
- Culture Wizard - Virtual Teams Survey - https://www.rw-3.com/culture-wizard
- FlexJobs - State of the Workforce Report - https://www.flexjobs.com/blog/post/state-of-the-workforce
- Gallup - Indicators: Hybrid Work - https://www.gallup.com/401384/indicator-hybrid-work.aspx
- Global Workplace Analytics - Remote Work Cost Savings - https://globalworkplaceanalytics.com/
- JobLeads - Remote Work Statistics 2026 - https://www.jobleads.com/
- Owl Labs - State of Hybrid Work 2025 - https://owllabs.com/state-of-hybrid-work/2025
- Pew Research Center - Future of Work - https://www.pewresearch.org/topic/economy-work/business-workplace/future-of-work/
- PNAS (Proceedings of the National Academy of Sciences) - Remote Work Carbon Footprint Study - https://www.pnas.org/
- Robert Half - Remote Work Statistics and Trends - https://www.roberthalf.com/
- U.S. Bureau of Labor Statistics - Telework Trends - https://www.bls.gov/cps/telework.htm
- We Work Remotely - Future of Remote Work Survey - https://weworkremotely.com/
- WFH Research (Stanford / Nick Bloom) - Survey of Working Arrangements and Attitudes - https://wfhresearch.com
- Zoom - Global Hybrid Work Study - https://zoom.us/
Related posts

Job Interviews & Find A Job
Discover the best US cities for digital nomads in 2026, with Las Vegas ranking #1 for affordability, sunshine, airport access and remote-work essentials.

Job Interviews & Find A Job
Want an online job but don't know where to start? Check out our article for a list of the best online jobs, top job boards, and tips on how to apply!

Job Interviews & Find A Job
Get ready for your job hunt with these 19 reasons for leaving a job and a guide on how to talk about it during job interviews.